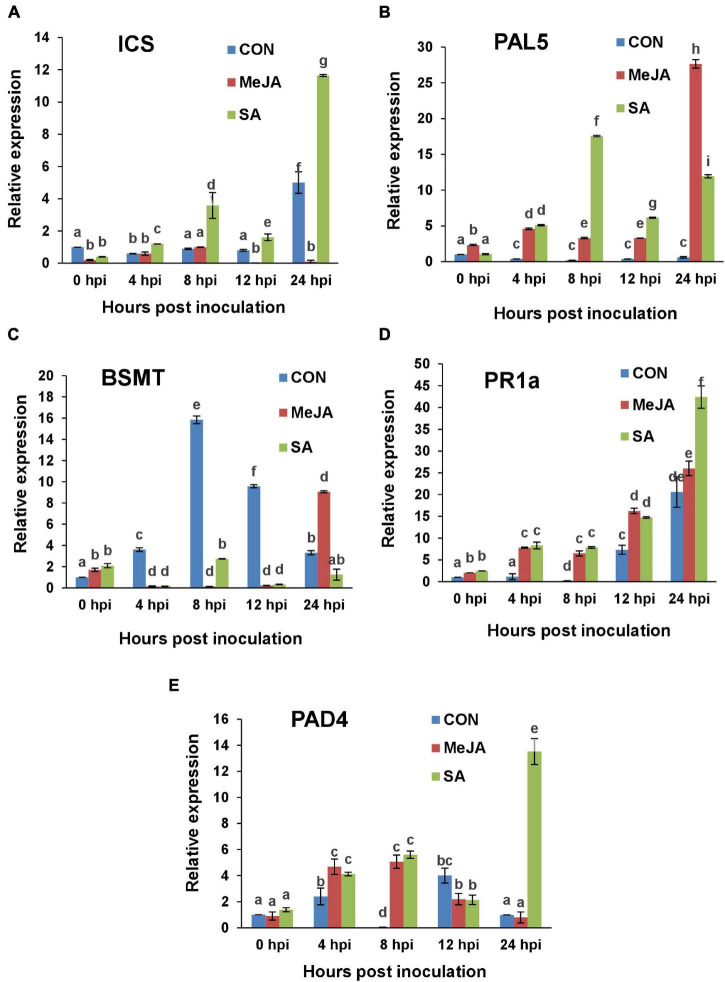
FIGURE 15.
RT-qPCR analysis of the expression of Salicylate signaling marker genes in primed and control plants post infection with R. solani. Graphs of Quantitative real-time RT-PCR analysis of genes over a time course in the first 24 h after infection: (A) Isochorismate synthase (ICS), (B) Phenylalanine ammonia lyase 5 (PAL5), (C) Salicylate/benzoate carboxyl methyltransferase (BSMT), (D) Pathogenesis-related protein-1a (PR1a), (E) Phytoalexin-deficient 4 (PAD4). Bars represent standard error (SE) of the mean (n = 3). Different letters indicate significant differences among treatments at p < 0.05, according to Duncan’s multiple range test.

