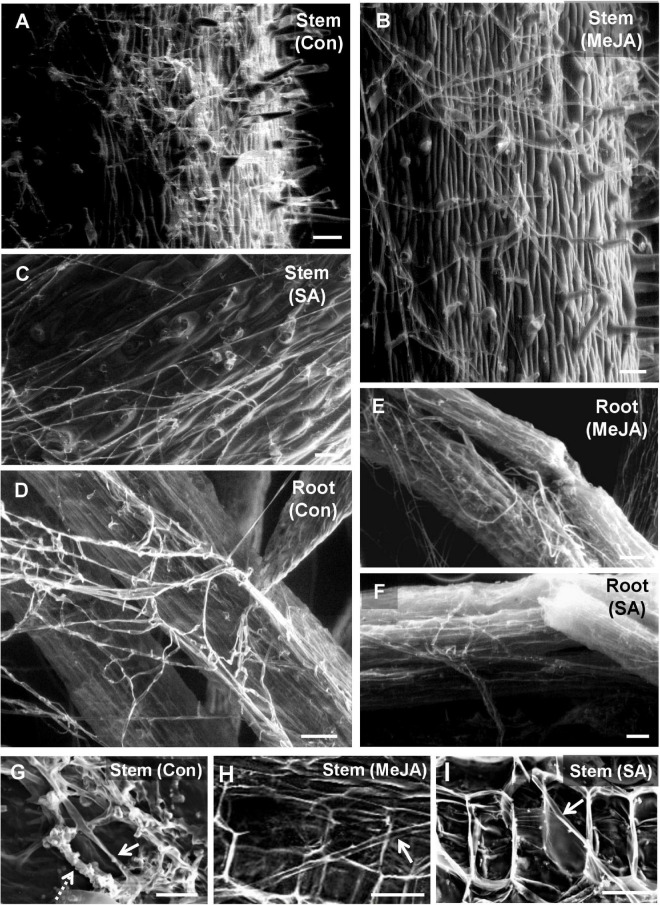
FIGURE 5.
Scanning electron microscopy of tomato stem and root surfaces showing differential behavior of R. solani hyphae at 2 days post-inoculation. (A) Profuse growth of hyphae covering the stem surface of control plants at 48 hpi forming tangled mats at places. (B) Significantly less growth of hyphae on the stem surface of MeJA pre-treated plants showing loose hyphal network. (C) SA pre-treated stem surface showing least hyphal load with the hyphae running straight without forming hyphal network (D) Roots of control plant showing a significant amount of thick hyphal growth on the surface, whereas a minimal growth of hyphae is found on MeJA-primed roots (E), and even less on SA-primed roots (F). Bar = 100 μm (G) Regular occurrence of intracellular (solid arrow) and thick bunches of intercellular hyphae outlining the individual cells (dashed arrow) within the stem cortical tissue as seen in the transverse section through the stem at 48 hpi. (H,I) Rare presence of thin intracellular hyphae (arrow) in certain regions of stem cortical tissue in MeJA (H) and SA (I)-primed pants, though at most regions, in the cortical tissues there was absence of any hyphae at 48 hpi. Bars = 50 μm.

