FIGURE 8.
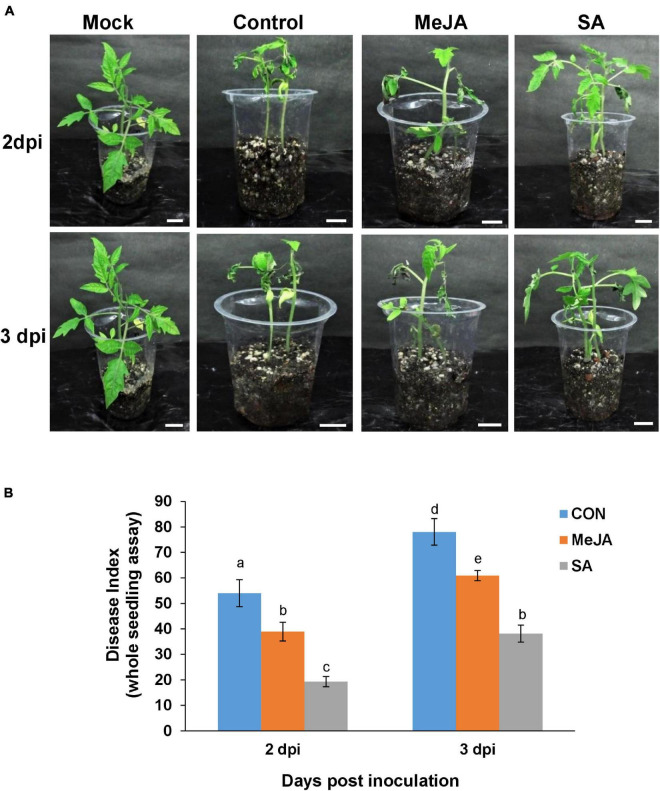
Whole seedling assay showing disease incidence by R. solani on phytohormone primed plants compared with control. (A) MeJA pre-treated plants showed less severe symptoms than the control and but more symptoms than SA-treated ones at 2 and 3 days post-inoculation, in the order Control > MeJA > SA. (B) Comparative graphical representation of disease index in the different experimental sets at 2 and 3 dpi, calculated according to the published method. Bars represent mean ± S.E.M of four independent experiments. Different letters indicate significant differences among treatments at p < 0.05, according to Duncan’s multiple range test. Bars = 2 cm.

