FIGURE 9.
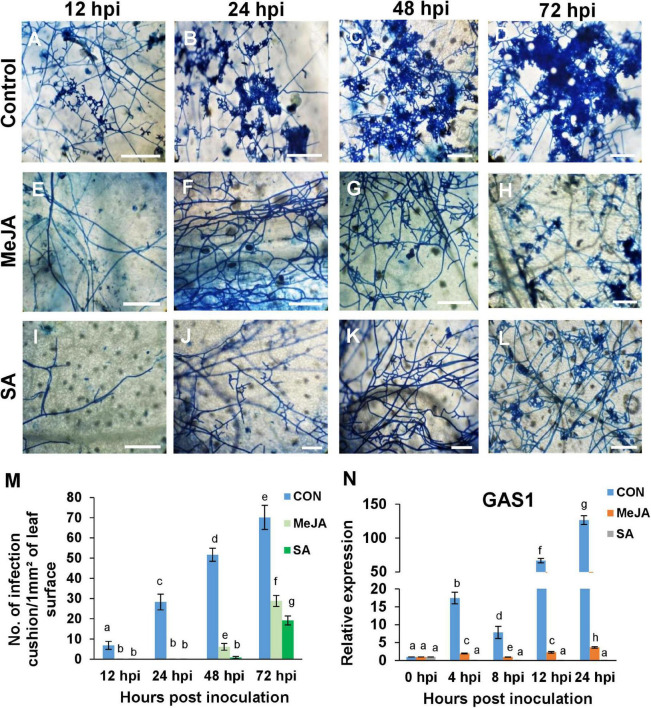
The priming status of the host has direct effect on the frequency of infection cushions, and the expression of the appressorial penetration-associated gene (GAS1) of the pathogen. (A–D) Development of infection cushions (seen as deep blue patches) was initiated as early as 12 h after inoculation in the control plants and progressed rapidly over time, until at 72 hpi, there was coalescence of the infection cushions. (E–H) MeJA priming significantly delayed this process and initiation started as late as 48 hpi. (I–L) Pre-treatment with SA reduced the formation of infection cushions further. At 72 hpi, SA sets showed smaller, more dispersed infection cushions than the MeJA sets. (M) Comparison of the density of infection cushions between the different sets. (N) Relative expression of appressorium-associated protein gene GAS1, showing significantly high transcript level in the control compared to the phytohormone treated sets, over a time course, with the SA sets showing least expression. Bars represent mean ± S.E.M of three independent experiments with three replicates. Different letters indicate significant differences among treatments at p < 0.05, according to Duncan’s multiple range test. Bar = 100 μm.

