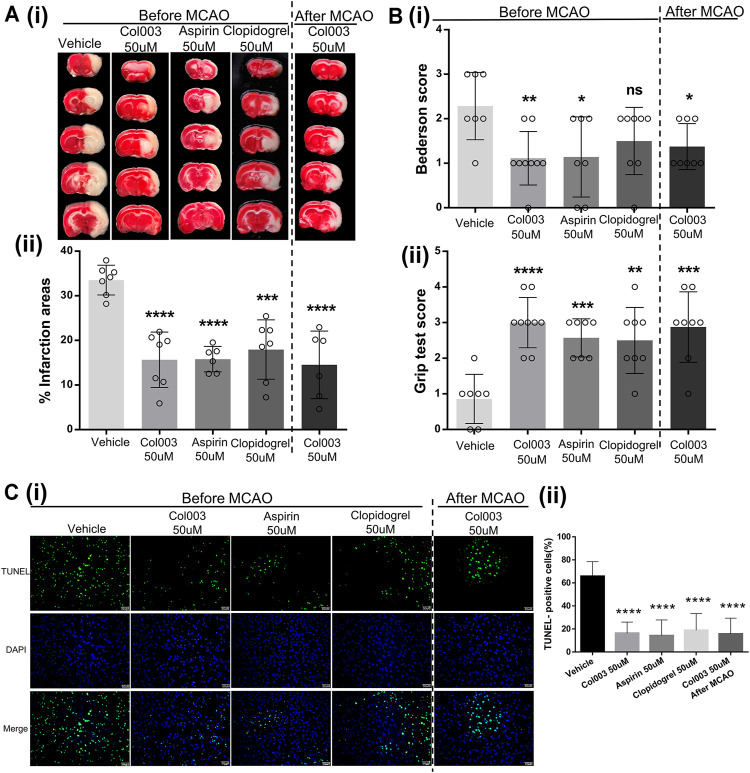
FIGURE 5.
The cerebral infarct volume and outcome of rats after MCAO. (Ai) Representative brain sections stained with TTC. Healthy tissue appeared red, whereas infarct areas stained white. (Aii) Brain infarct volumes of different groups were quantified by planimetric analysis. The infarction areas (%) in the five groups were 33.52 ± 1.26% (Vehicle), 15.66 ± 2.34% (Col003 50uM before), 15.81 ± 1.17% (Aspirin 50uM before), 17.95 ± 2.52% (Clopidogrel 50uM before), 14.53 ± 3.09% (Col003 50uM after), respectively. (Bi) Bederson’s test was used to access neurological outcome. The Bederson’s score in the five groups were 2.29 ± 0.29 points (Vehicle), 1.11 ± 0.20 points (Col003 50uM before), 1.14 ± 0.34 points (Aspirin 50uM before), 1.50 ± 0.27 points (Clopidogrel 50uM before), 1.38 ± 0.18 points (Col003 50uM after), respectively. (Bii) Grip strength test was used to examine the motor function. The grip score in the five groups were 0.86 ± 0.26 points (Vehicle), 3.00 ± 0.24 points (Col003 50uM before), 2.57 ± 0.20 points (Aspirin 50uM before), 2.50 ± 0.33 points (Clopidogrel 50uM before), 2.88 ± 0.35 points (Col003 50uM after), respectively. n = 7–9; *p < 0.05, **p < 0.01, ***p < 0.001, and ****p < 0.0001 (vs vehicle group). (Ci) Representative micrographs of TUNEL staining. (Cii) Quantitation of TUNEL-positive neurons. The TUNEL-positive cells (%) in the five groups were 65.80 ± 3.51% (Vehicle), 16.39 ± 2.76% (Col003 50uM before), 14.21 ± 4.32% (Aspirin 50uM before), 18.90 ± 4.59% (Clopidogrel 50uM before), 15.68 ± 4.32% (Col003 50uM after), respectively. n = 3; ****p < 0.0001 (vs vehicle group). Statistical methods for the above experiments using unpaired two-tailed Student’s t-test.

