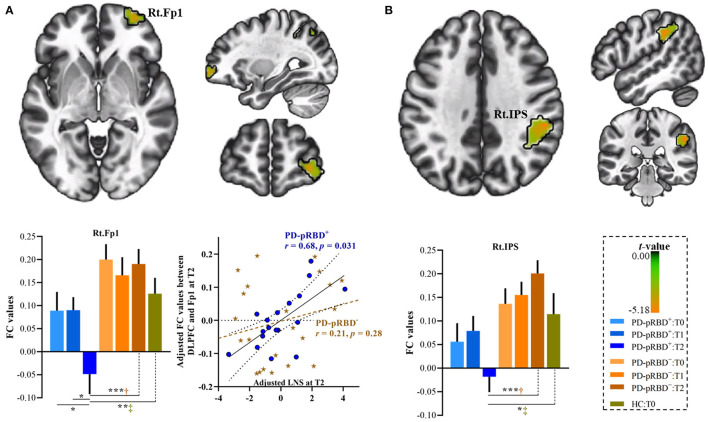
Figure 5.
Progressive FC decrease in the left DLPFC in PD-pRBD+ compared with PD-pRBD− at 3-year follow-up evaluation. (A) Decreased FC in the right Fp1; (B) Decreased FC in the right IPS. Bar graph showed the mean extracted FC values in these regions. Scatter plots presented the relationship between FC values and scores of LNS test. The results were thresholded based on an uncorrected voxelwise height threshold of p < 0.001 combined with an FWE-corrected clusterwise threshold of p < 0.05. Mixed repeated measures analysis of variance was performed to compare the longitudinal changes between PD groups with visit-time (i.e., T0, T1, T2) as within-group factor and group (i.e., PD-pRBD+ and PD-pRBD−) as between-group factor. Post-hoc comparisons were further performed to determine longitudinal changes over time within group and differences between groups at each visit time. Raw data for LNS and FC were adjusted for confounding variables of age, sex, education, disease duration, and levodopa dose, as demonstrated in x-axis and y-axis. Fp1, lateral frontopolar area 1; LNS, letter-number sequencing; IPS: intraparietal sulcus; T0, fMRI data at onset; T1, the 1-year follow-up evaluation; T2, the 3-year follow-up evaluation. PD-pRBD+, Parkinson's disease (PD) with probable rapid eye movement (REM) sleep behavior disorder (pRBD); PD-pRBD−, PD without pRBD; Lt, left; Rt, right. †showed significant differences between patients with PD-pRBD+ and PD-pRBD−; ‡showed significant differences between PD-pRBD+ patients and HCs. *p < 0.05 with Bonferroni correction; **p < 0.005 with Bonferroni correction; ***p < 0.001 with Bonferroni correction.

