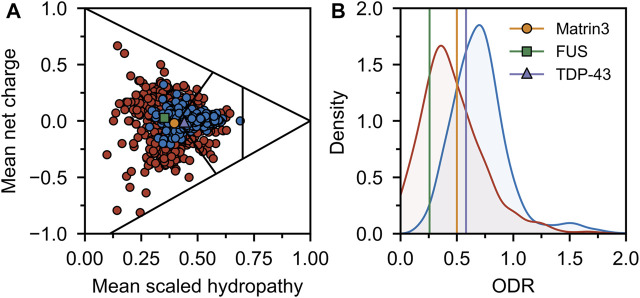
FIGURE 4.
Sequence disorder analysis. (A) Charge-hydropathy plot. The plot is based on the method introduced by Uversky et al. (Uversky et al., 2000; Uversky, 2017) and compares the mean net charge and mean Kyte-Doolittle hydropathy (Kyte and Doolittle, 1982) (scaled between 0 and 1). Linear boundaries are used to separate various groups of proteins (from left to right extended IDPs, compact soluble proteins, and insoluble proteins). A random sample of ordered (blue) and disordered (red) proteins was taken from the Swiss-Prot (The UniProt Consortium, 2018) and Disprot 7.0 (Piovesan et al., 2016) databases respectively and plotted. Matrin3, FUS and TDP-43 are indicated. (B) ODR ratio distribution plot. The same sample as in (A) was used to compute the ratio of the order-promoting to disorder-promoting residues with value truncation at 0 and 2. Disordered proteins (red) show a lower ratio (i.e., more disorderpromoting) than ordered proteins (blue).

