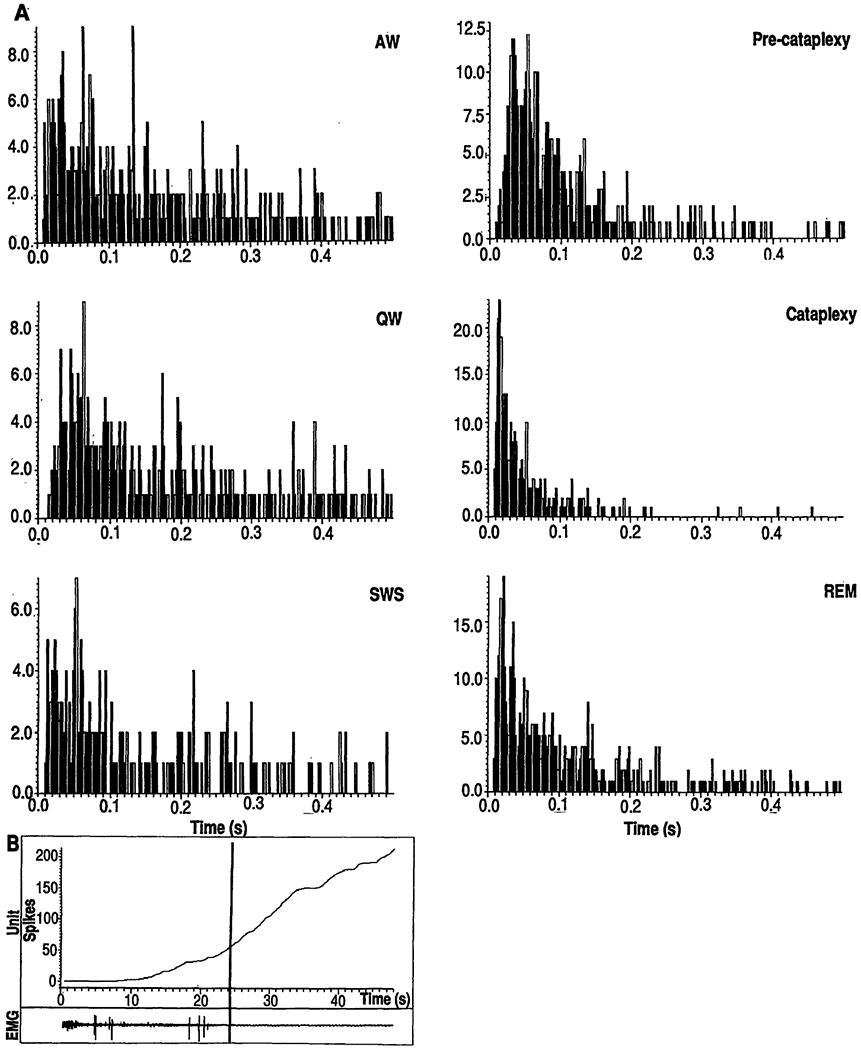
Fig. 3.

(A) Interspike interval histograms of a cataplexy-on cell as a function of state. The x axis is the Interspike interval in seconds; the y axis is the frequency of spikes separated by interval. SWS, slow wave sleep (non-REM sleep). (B) Cummulative histogram of the discharge of a cataplexy-on cell. Vertical line, point of a cataplexy onset. Lower trace shows a computer plot of the EMG during the period of the histogram.
