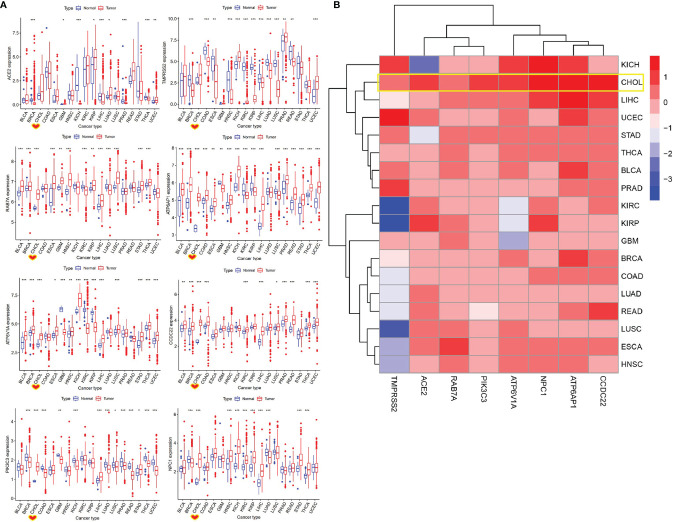
Figure 4.
Identification of differentially expressed SARS-CoV-2-required genes between cancer and control samples. (A) The expression of SARS-CoV-2-required genes between cancer and control samples. *P < 0.05, **P < 0.01, ***P < 0.001. (B) Heatmap of log2 (fold change) for SARS-CoV-2-required genes between cancer and control samples. Blue represents downregulation, Red presents upregulation.

