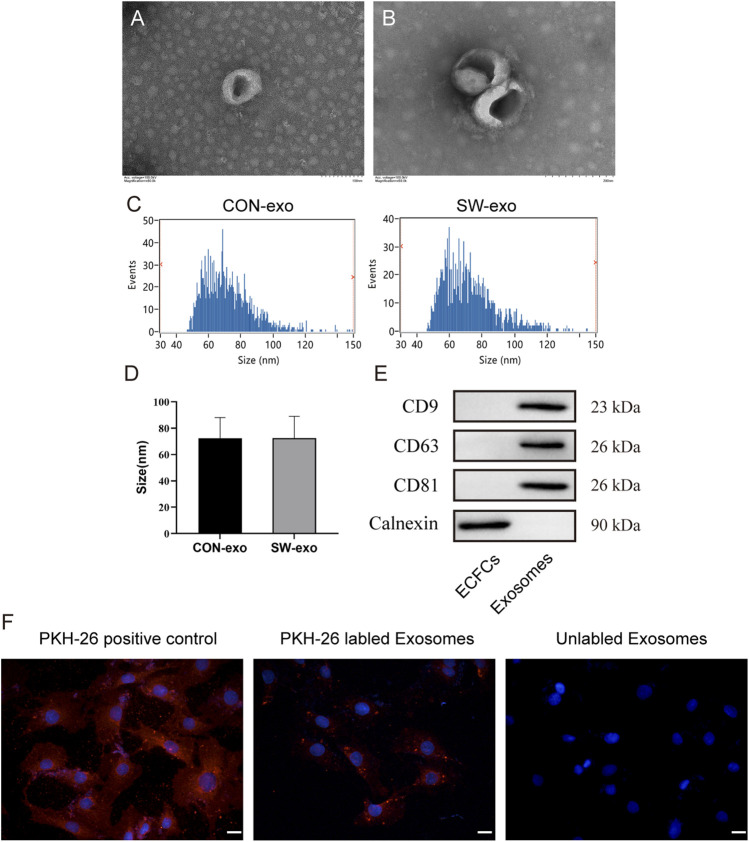
FIGURE 2.
Characterization of exosomes derived from ECFCs. (A-B). exosome morphology was evaluated via transmission electron microscopy, scale bar = 100–200 nm. (C-D) The size distribution of exosomes was analyzed by nanoparticle tracking analysis. The diameter of exosomes ranges mainly from 30 to 150 nm. (E) Western blot analysis of protein levels of CD9, CD63, CD81, and calnexin in cell lysis and ECFCs-exo. (F) H9c2 cells were incubated with PKH26 (positive control), PKH26-labeled exosomes, and unlabeled exosomes, nuclei were counterstained with DAPI, and the red fluorescence of PKH-26 in cells was traced by fluorescence microscope, scale bar = 20 μm.

