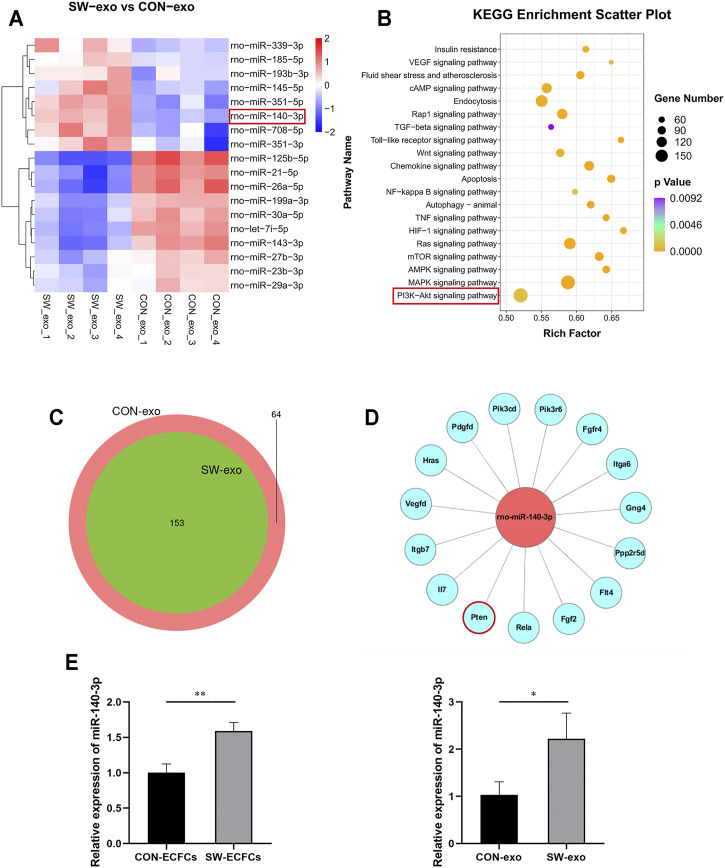
FIGURE 5.
Characterization of miRNA sequences in SW-exo and CON-exo, and functional enrichment analysis. (A) Relative amounts of expression for 18 miRNAs enriched in SW-exo and CON-exo are displayed in a heat-map (p < 0.05, n = 4). (B) Kyoto Encyclopedia of Genes and Genomes (KEGG) functional enrichment analysis of differential target genes was displayed in a scatter plot. (C) Venn diagrams of detected miRNAs (SW-exo vs. CON-exo) shows a large overlap between the two groups. (D) Mapping of miR-140-3p and target gene network in the PI3K/AKT signaling pathway was drawn by Cytoscape software. (E) The relative expression of miR-140-3p in ECFCs and ECFCs-exo were detected by qRT-PCR normalized to U6 (n = 3). *p < 0.05, **p < 0.01.

