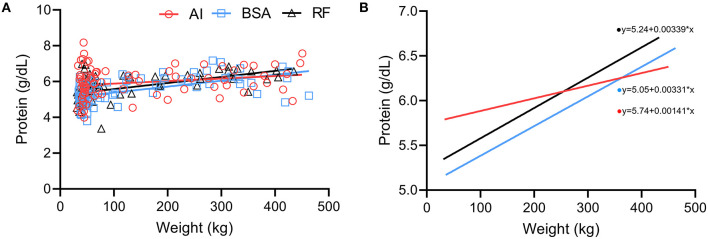
Figure 9.
Comparison between weight (kg) and protein concentration (g/dL) obtained during the first year of life from calves born after artificial insemination (AI), in vitro produced with bovine serum albumin (BSA), and in vitro produced with reproductive fluids (RF). (A) Each symbol represents one individual value, where red circles represent AI calves; blue squares, BSA calves; and black triangles, RF calves—the lines represent the linear regression. (B) Simple linear regression of the values obtained in panel (A), where red represents AI calves; blue, BSA calves; and black, RF calves.

