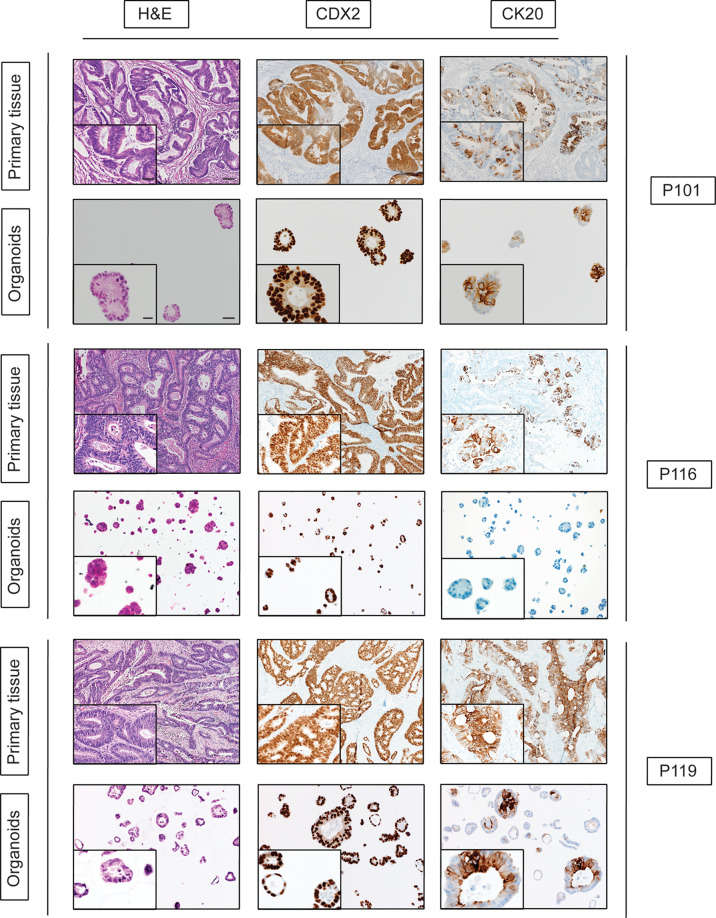
Figure 6.
Histologic and immunophenotypic characterization of CRC organoids. Representative micrographs of matched tissue–organoids pairs. Both tissues and organoids sections were stained with hematoxylin–eosin (H&E, left side), CDX2, and CK20 antibodies. For primary tissue pictures, scale bars indicate a size of 100 µm for the picture with lower magnification and 25 µm for the one with higher magnification. For PDOs picture, scale bars are 50 µm and 10 µm for lower and higher magnification, respectively.

