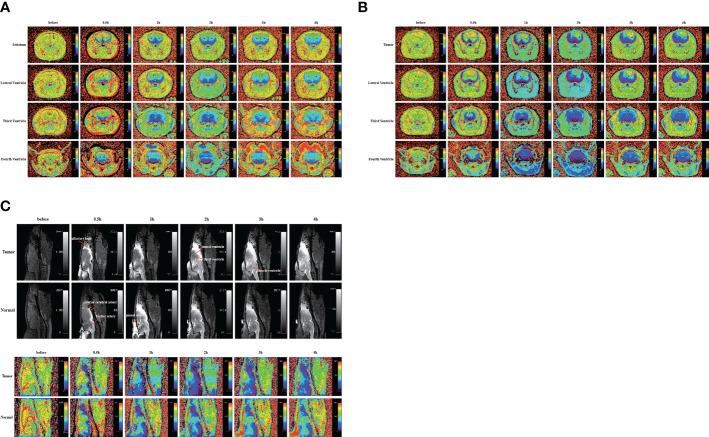
Figure 2.
Gadobutrol distribution in the different parts of the brain in 0.5, 1, 2, 3, and 4 h. (A) The T1−mapping images in the coronal plane of the normal group. (B) The T1−mapping images in the coronal plane of the tumor group. (C) The T1-weighted images and the T1−mapping images in the sagittal plane of the tumor and normal groups. The black circles represent regions of interest (n = 9 per group).

