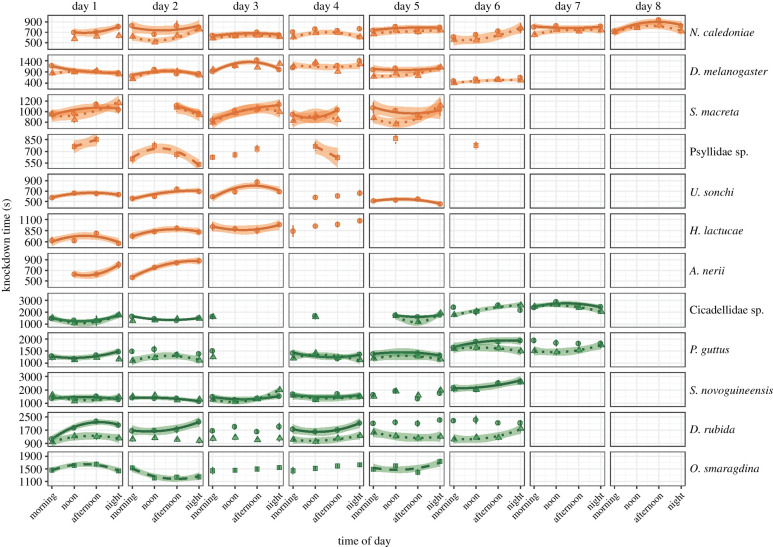
Figure 2.
Mean knockdown times (HKDT) measured multiple times (1–4) daily and across days for each species from temperate locations (orange) and tropical locations (green). The knockdown temperatures are displayed for males (triangles) and females (circles) separately when sex was identified, and squares display species for which sex could not be determined. Bars are standard errors of the means. Significant relations between the HKDT and ‘time of day’ were visualized by polynomial or linear regressions with 95% confidence bands. Solid regression lines represent females, dotted lines are for males, and dashed lines are provided for species of unknown sex. (Online version in colour.)

