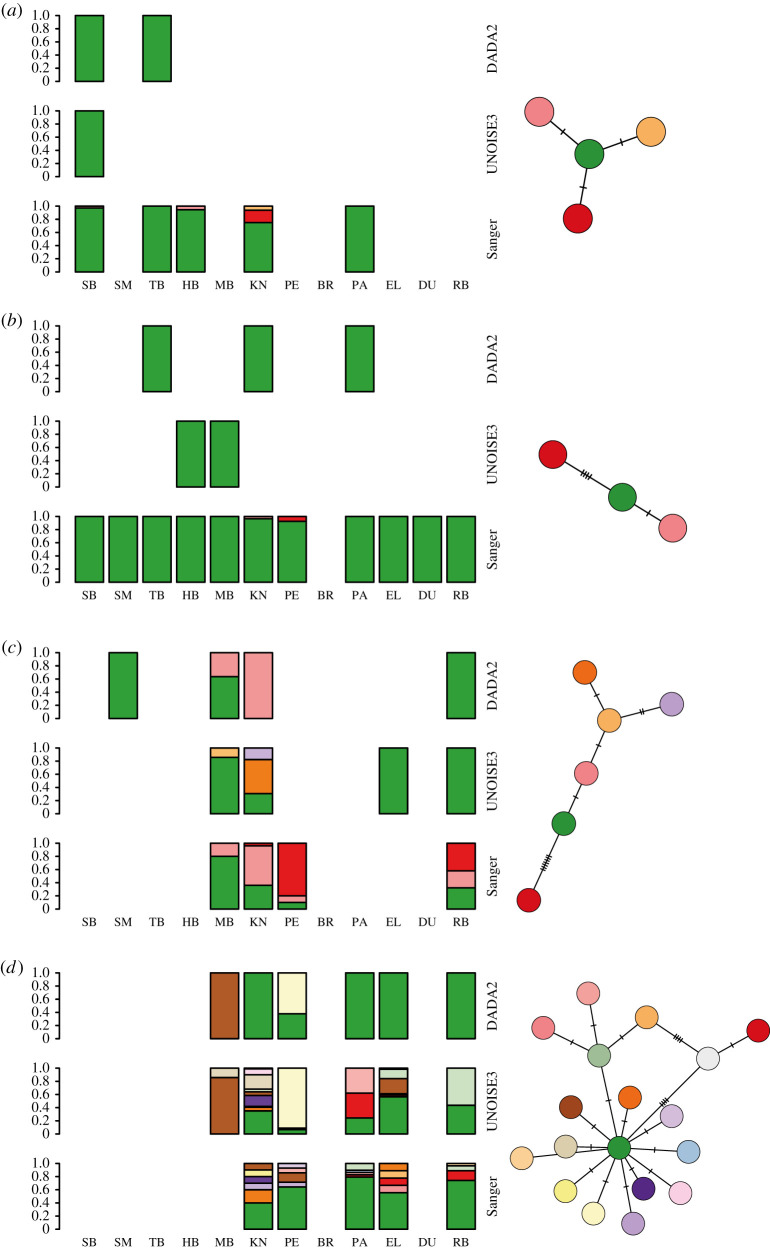
Figure 3.
Haplotype proportions recovered using eDNA metabarcoding for (a) Ciona robusta, (b) Clavelina lepadiformis, (c) Styela plicata and (d) Microcosmus squamiger along the South African coastline. Results are shown for analysis of COI eDNA metabarcoding data using the denoising software DADA2 and UNOISE3 for each species; site abbreviations follow electronic supplementary material, table S1. Haplotype networks based on minimum spanning distance are shown for each species with colours matching the bar plot within species; the number of cross-hatches indicates single nucleotide mutation steps between haplotypes.

