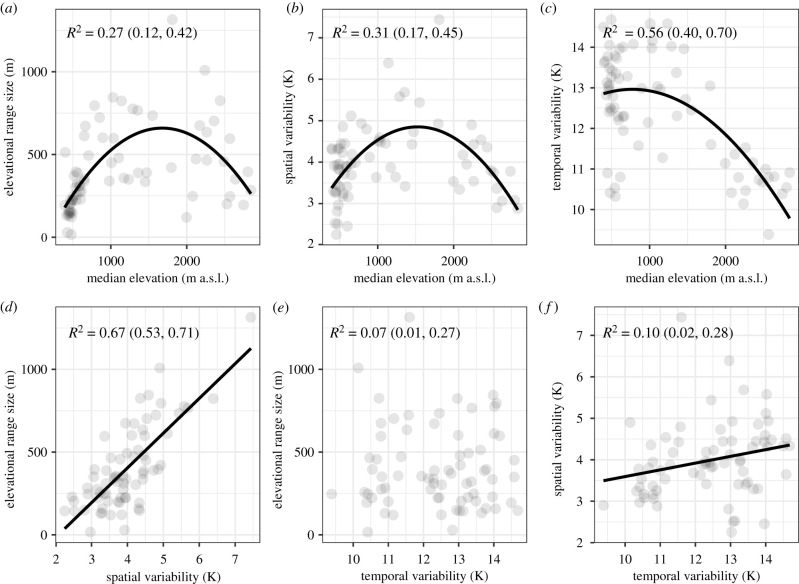
Figure 2.
Relationships among environmental variables. For all pairs of variables, the better-supported relationship is indicated, either linear (solid line) or quadratic (solid curve), or neither of them was found significant. R2 is the median Bayesian R-squared, with the 90% CI in brackets. Each dot represents a species.

