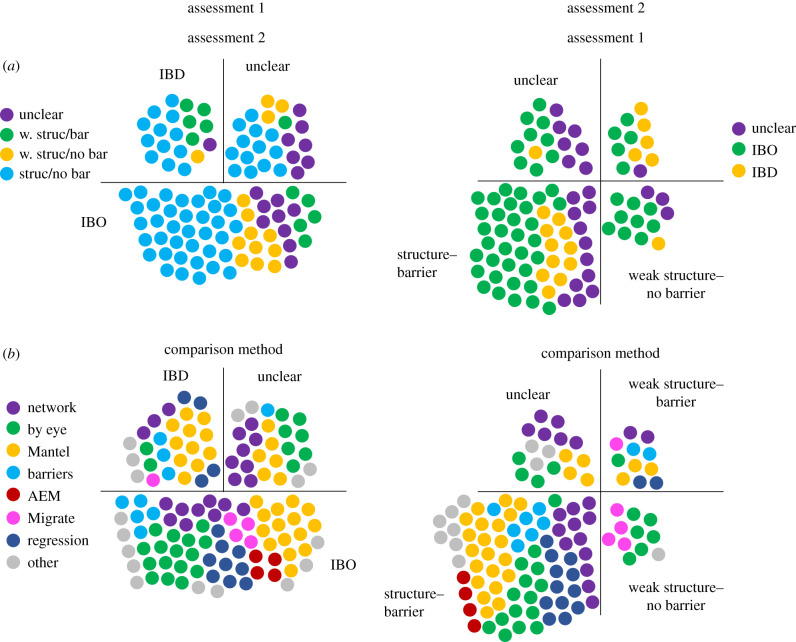
Figure 3.
Plots of the classification scheme in assessment 1 (table 1) and assessment 2 (table 2) of the 103 cases. Shown in (a) is how the cases classified in assessment 1 are classified in assessment 2 and vice versa (w. struc/bar, ‘weak structure–barrier’; w. struc/no bar, ‘weak structure–no barrier’; struc/bar ‘structure–barrier’). Shown in (b) are the methods used for the studies concluding fit according to our assessments 1 and 2. (Online version in colour.)

