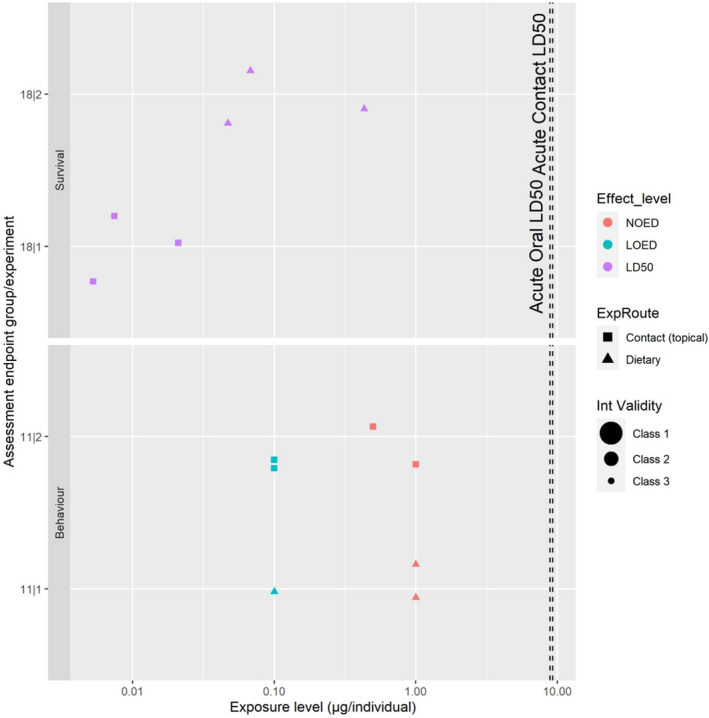
Figure 12.

Summary plot of the available data on honey bee adults acutely exposed to acetamiprid under laboratory conditions. Each line on the y‐axis represents an experiment within a reference (e.g. XX|Y indicate experiment Y within reference XX), organised by assessment endpoint group (survival, behavioural). Colours identify the type of measured endpoint (effect level), shapes the route of exposure (contact, dietary), and size of the markers identify the internal validity class (class 1 representing low risk of bias). Vertical dashed lines highlight the endpoints available in the EU peer review (EFSA, 2016)
