
Figure 13.
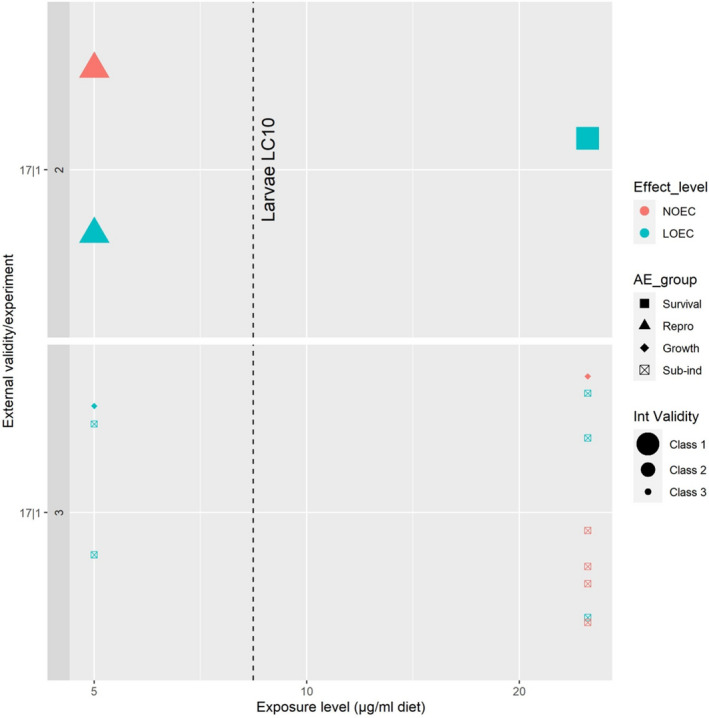
Summary plot of the honey bee larval and adult data available for prolonged exposure to acetamiprid under laboratory conditions. Each line on the y‐axis represents an experiment within a reference (e.g. XX|Y indicate experiment Y within reference XX), organised by external validity class (class 1 representing low risk of bias). Colours identify the type of measured endpoint (effect level), shapes the assessment endpoint group, and size of the markers identify the internal validity class (class 1 representing low risk of bias). The vertical dashed line highlights the endpoints available in the EU peer review (EFSA, 2016)