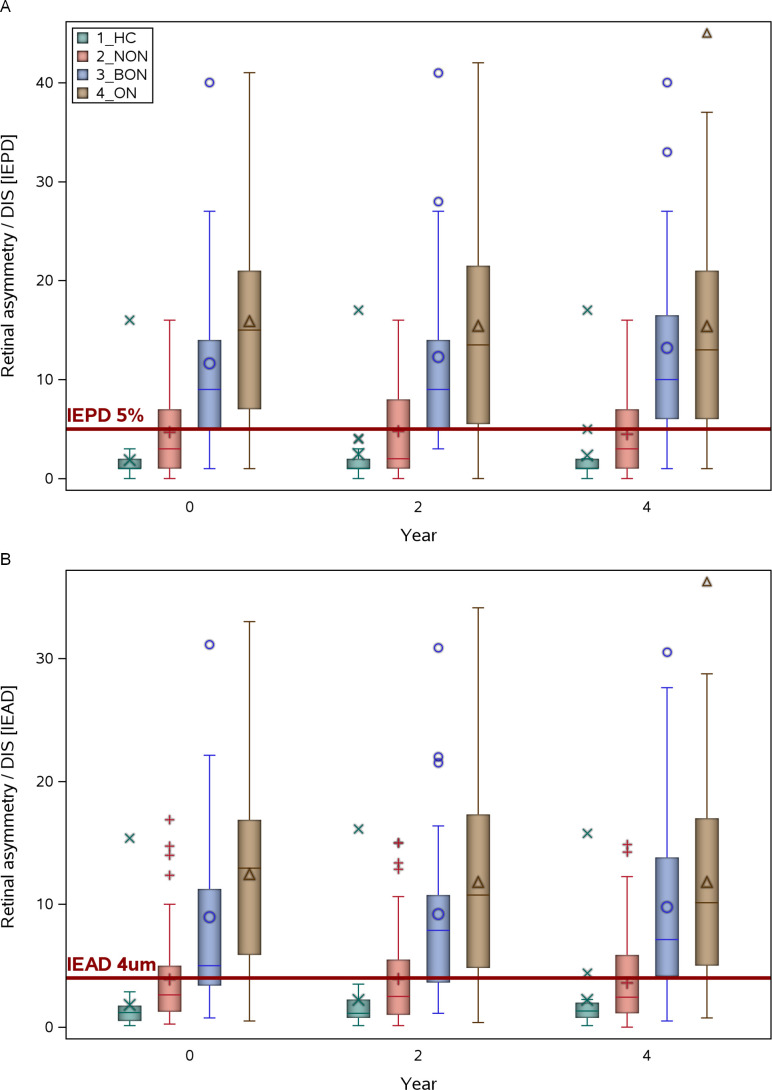
Figure 1.
Box-and-Whisker plots of (A) the inter-eye percentage differences (IEPD) and (B) the inter-eye absolute difference (IEAD) at baseline, year 2 and year 4. The red line indicates the 5% cut-off for the IEPD and the 4 µm cut-off of the IEAD. BON, bilateral MS associated optic neuritis; HC, healthy controls; MS, multiple sclerosis; NON, no MS associated optic neuritis; ON, unilateral MS associated optic neuritis. The median (bold horizontal line), 25–75 percentiles (box), 5–95 percentiles (whiskers), mean (symbol in the box) and outliers (symbols outside the box) are shown.

