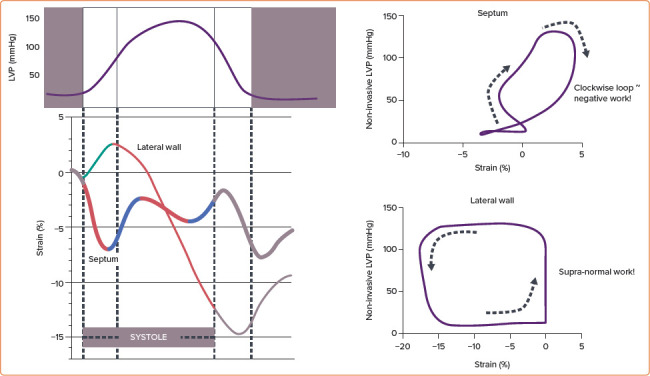
Figure 2. Calculation of Regional Pressure-work Loops.

Synchronisation of the left ventricular pressure curve (upper left) and septum and lateral wall strain curves (lower left) of the LBBB patient presented in Figure 1 and pressure-strain loops constructed from such data (right panels). LBBB = left bundle branch block; LVP = left ventricular pressure. Source: Left panel: De Boeck et al. 2009.[33] Adapted with permission from John Wiley & Sons. Right panel: Russell et al. 2012.[2] Adapted with permission from Oxford University Press.
