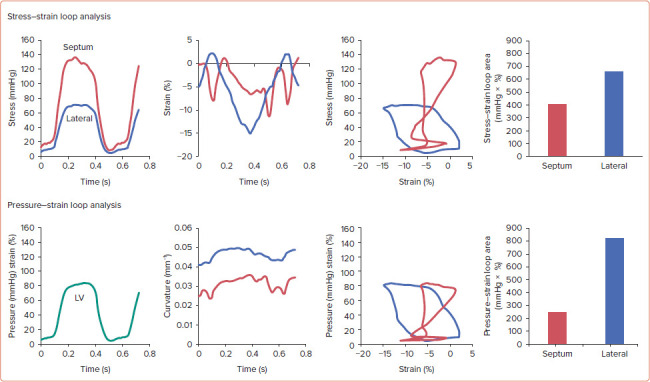
Figure 3. Conceptual and Practical Difference between Pressure–Strain and Stress–Strain Analysis.

Stress–strain and pressure–strain loop analysis of an animal model of ventricular dyssynchrony. Note the higher stress for the septal wall (red), and lower stress for the lateral wall (blue), compared to the left ventricular pressure trace (green), which assumes uniform wall stress (first column). Source: Mills et al. 2009.[31] Reproduced with permission from Wolters Kluwer.
