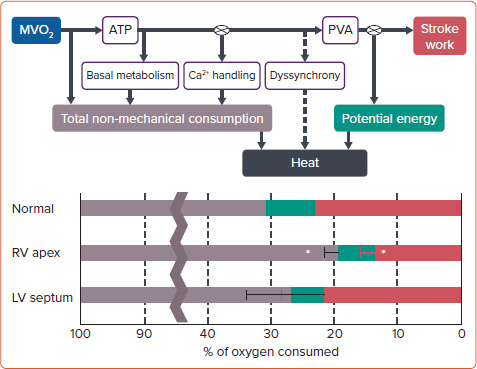
Figure 4. Cardiac Efficiency During Various Modes of Pacing.

Upper panel: steps in the energy transfer from oxygen uptake by the myocardium (MVO2) to stroke work and the various sources of dissipation of energy into heat. A box with ‘dyssynchrony’ is added to this scheme, based on the observation of ‘wasted work’ as discussed in the text. Lower panel: horizontal bars indicating the total amount of oxygen consumed and the contribution of external work (red) and potential work (green). ATP = adenosine triphosphate; LV = left ventricular; RV = right ventricular; PVA = pressure–volume area. Data source: Duchenne et al. 2019.[22]
