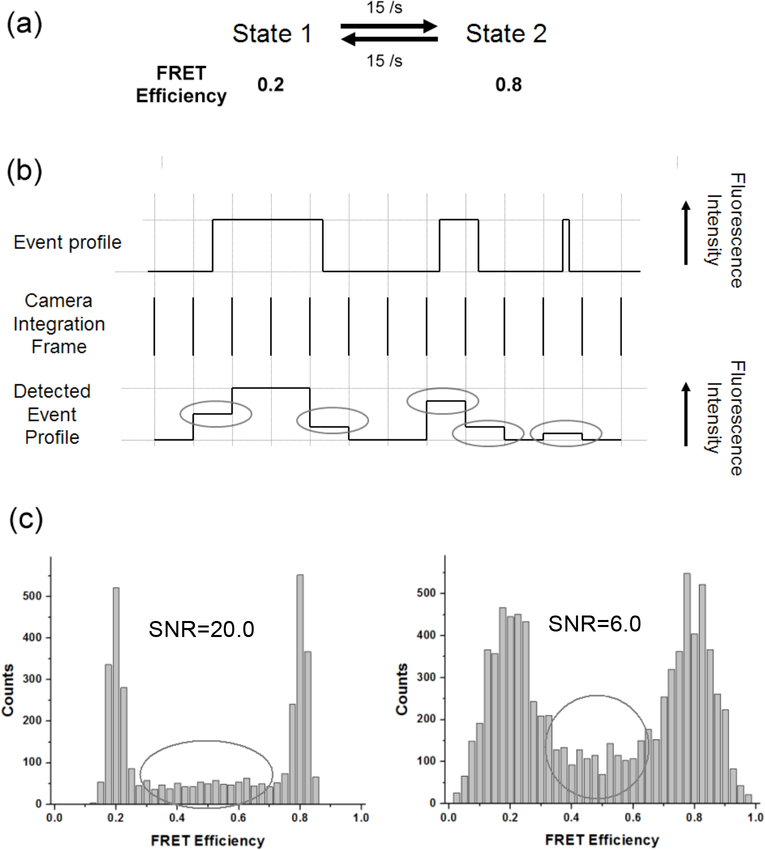
Fig. 1.
The effect of short lifetime events and the unsynchronized detection on FRET efficiency distribution. (a) Kinetic scheme of the simulated traces. Two sets of SNR (20.0 and 6.0) were simulated. (b) Illustration of real events and detected events showing examples of short lifetime events and the unsynchronized events to the detector time bin. The first and the last detected frame of the first long lifetime event do not have the same fluorescence intensity level as the rest of the frames in the middle. The second event with a lifetime similar to the detection integration time also registers two frames with lower fluorescence level than normal. The third short lifetime event will register a single frame with a lower fluorescence intensity level than normal. The gray ellipses indicate these abnormal low fluorescence intensities resulting from either the unsynchronized detection or short lifetime events. (c) SM FRET histograms from simulated traces with the kinetic scheme in (a). As SNR becomes higher, randomly scattered FRET efficiency counts between the two FRET peaks become evident (counts in gray ellipses). These counts are due to short lifetime events and the unsynchronized detection.

