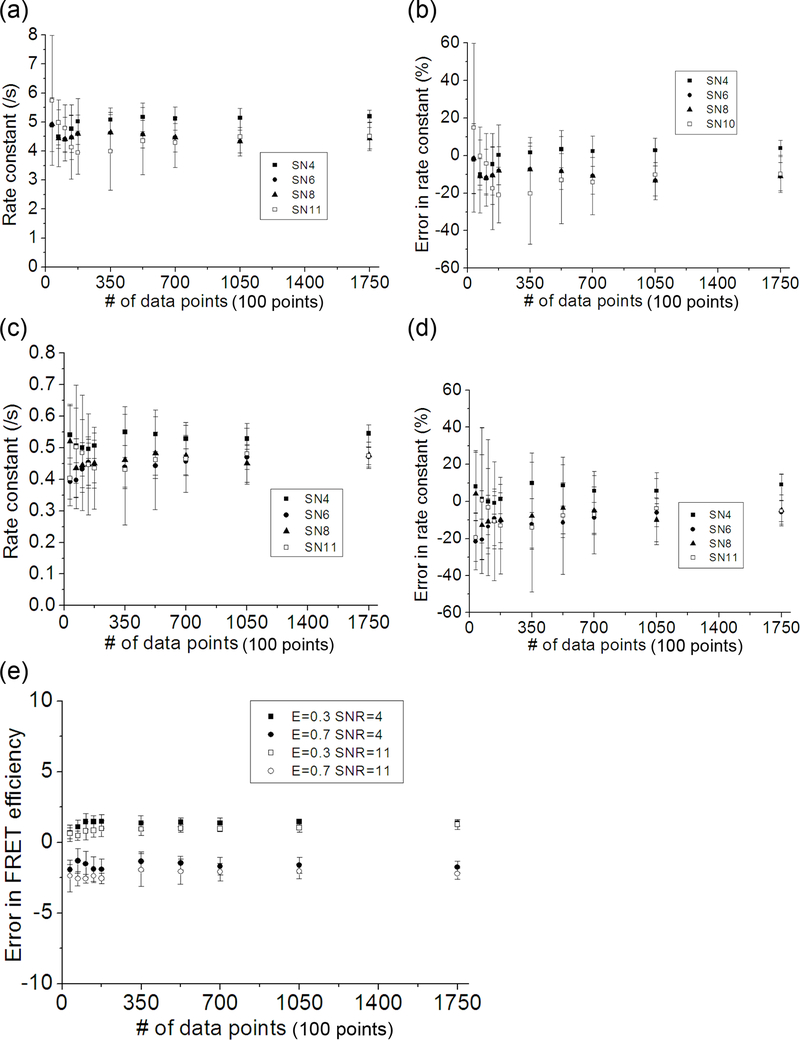
Fig. 4.
The effect of the amount of data on the performance of HMM optimization. The simulation conditions are the same as in Fig. 3 except that the optimization was performed using only the modified distribution function (Eq. 6) and the kinetic rates are fixed at 0.5 /s and 5.0 /s respectively for the forward and the backward rates. The amount of data used in the optimization was varied (10, 20, 30, 40, 50, 100, 150, 200, 300, and 500 traces which are equivalent to 3500, 7000, 10500, 14000, 17500, 35000, 52500, 70000, 105000, and 175000 data points) and the SNR was also varied (4.0, 6.0, 8.0, and 11.0). “SNR” is further abbreviated to “SN” in charts (a)~(d). (a) The optimized backward rates (5.0 /s) plotted against the number of data points used in the optimization. (b) The errors in the optimized backward rates plotted against the number of data points. (c) The optimized forward rates (0.5 /s) plotted against the number of data points used in the optimization. (d) The errors in the forward rates plotted against the number of data points. (e) Errors in the optimized FRET efficiency levels plotted against the number of data points used in the optimization.

