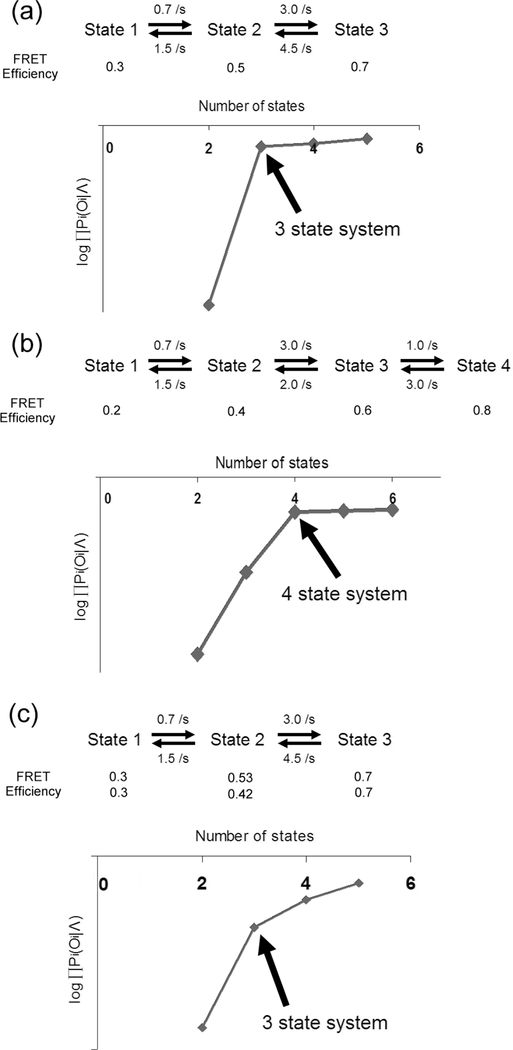
Fig. 8.
Demonstration of deducing the number of hidden states from SM FRET traces. Two 3-state systems and one 4-state system were simulated with the given rates and FRET efficiencies. SNR 6.0 was used (noise solely from Poissonian photon emission statistics). Fifty traces per each were simulated for (a) ~ (c) (350 time points per trace). In (c), two sets of FRET efficiencies (30 and 20 traces) were simulated. Each set of 50 traces were used to optimize the model parameters with 3 ~ 6 states. Each chart in (a) ~ (c) shows plotted against the number of states used in the optimization. In each case of (a) ~ (c), there is a distinct number of state where drops abruptly informing the smallest number of required states to model the observation sequence. These points are indicated with arrows. In a noisier data set (c), change is not as abrupt as in cases (a) and (b). Nevertheless, it is straightforward enough to identify the number of states in (c). In charts, is abbreviated to .

