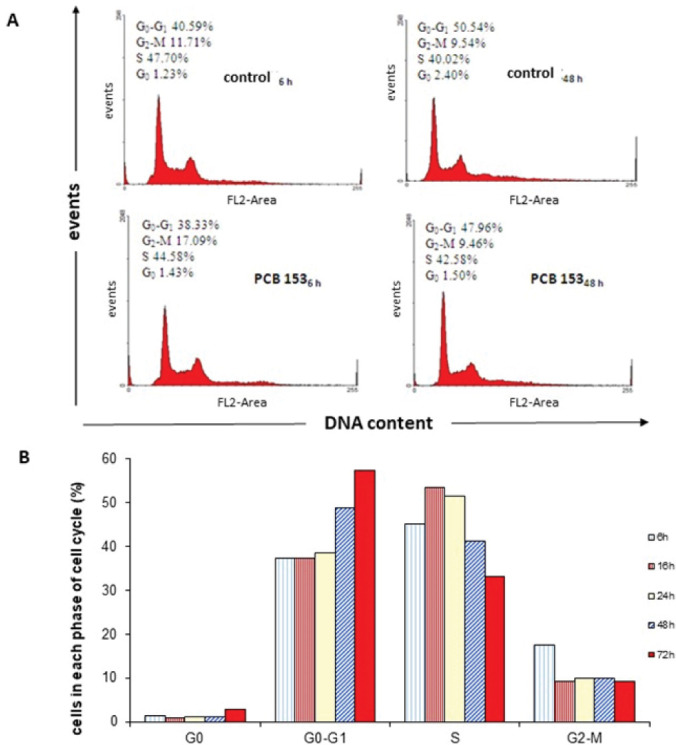
Figure 4.

CHO-K1 cell cycle analysis after exposure to 50 μmol/L PCB 153. (A) representative flow cytometric histograms of cell cycle progression after 6 and 48-hour exposure (B) Distribution (percentage) of exposed cells across the cell cycle phases over 72 h
