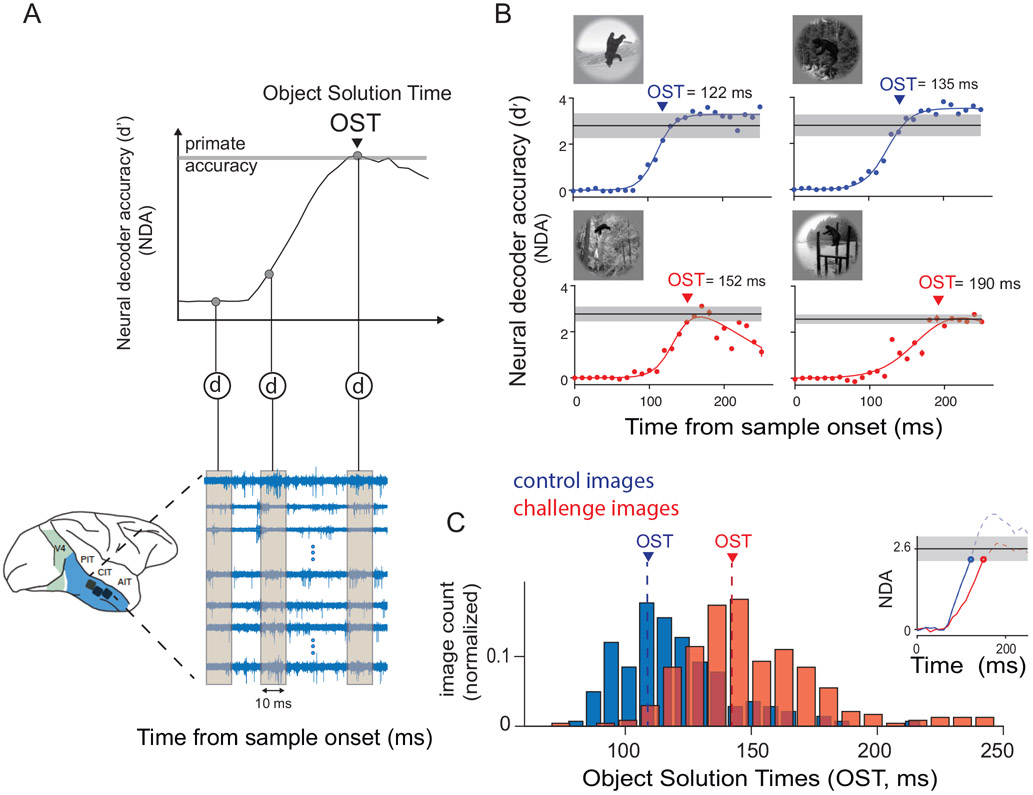
Figure 2.
Large scale multiunit array recordings in the macaque inferior temporal cortex. A) Schematic of array placement, neural data recording and object solution time estimation. We recorded extracellular voltage in IT from two monkeys, each hemisphere implanted with 2 or 3 Utah arrays. For each image presentation (100 ms), we counted multiunit spike events (see Methods for details), per site, in non overlapping 10 ms windows, post stimulus onset to construct a single population activity vector per time bin. These population vectors (image evoked neural features) were then used to train and test cross-validated linear support vector machine decoders (d) separately per time bin. The decoder outputs per image (over time) were then used to perform a binary match to sample task, and obtain neural decode accuracies (NDA) at each time bin. An example of the neural decode accuracy over time is shown in the top panel. The time at which the neural decodes equal the primate (monkey) performance, is then recorded as the object solution time (OST) for that specific image. B) Examples of IT population decodes over time, with the estimated object solution times for four images; two control (top panel: blue curves) and two challenge images (bottom panel: red curves). The red and blue dots are the estimated neural decode accuracies at each time bins. The solid lines are nonlinear fits of the decoder accuracies over time (see Methods). The gray lines indicate the I1 performance of the primates (pooled monkey) for the specific images. Error bar indicates bootstrapped s.e.m. C) Distribution of object solution times for both control (blue) and challenge (red) images. The median OST for control (blue) and challenge (red) images are shown in the plot with dashed lines. The inset in the top shows the median evolution of IT decodes over time until the OST for control (blue) and challenge (red) images.

