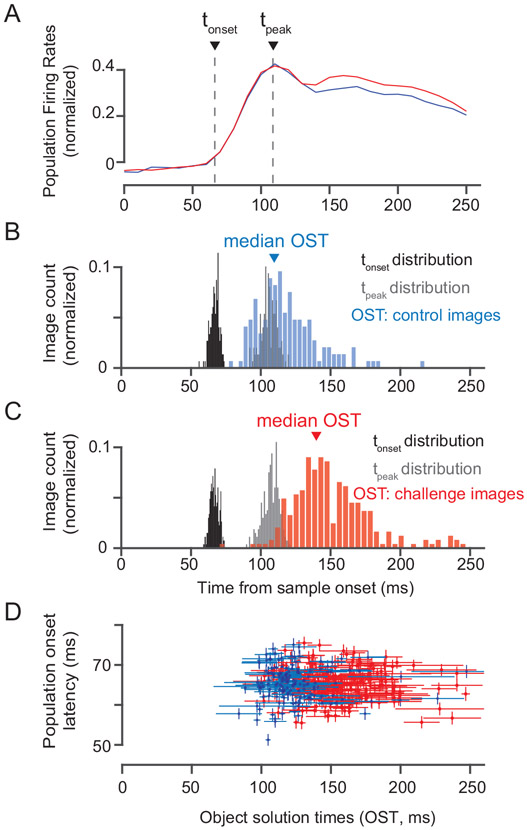
Figure 3.
Relationship between object solution times and neural response latencies. A) Comparison of neural responses evoked by control (blue) and challenge (red) images. We estimated two measures of population response latency: Population onset latency (tonset) and Population peak latency (tpeak). B) Distributions of the population onset latencies (median across 424 sites), population peak response latencies (median across 424 sites) and object solution times for control images (n=149). C) Same as in B) but for challenge images (n = 266). D) Comparison of population onset latencies and object solution times for both control (blue; n = 149 images) and challenge images (red; n = 266 images). Vertical error bars show s.e.m across neurons and horizontal error bars show bootstrap (across trial repetition) standard deviation of OST estimates.

