
Figure 6.
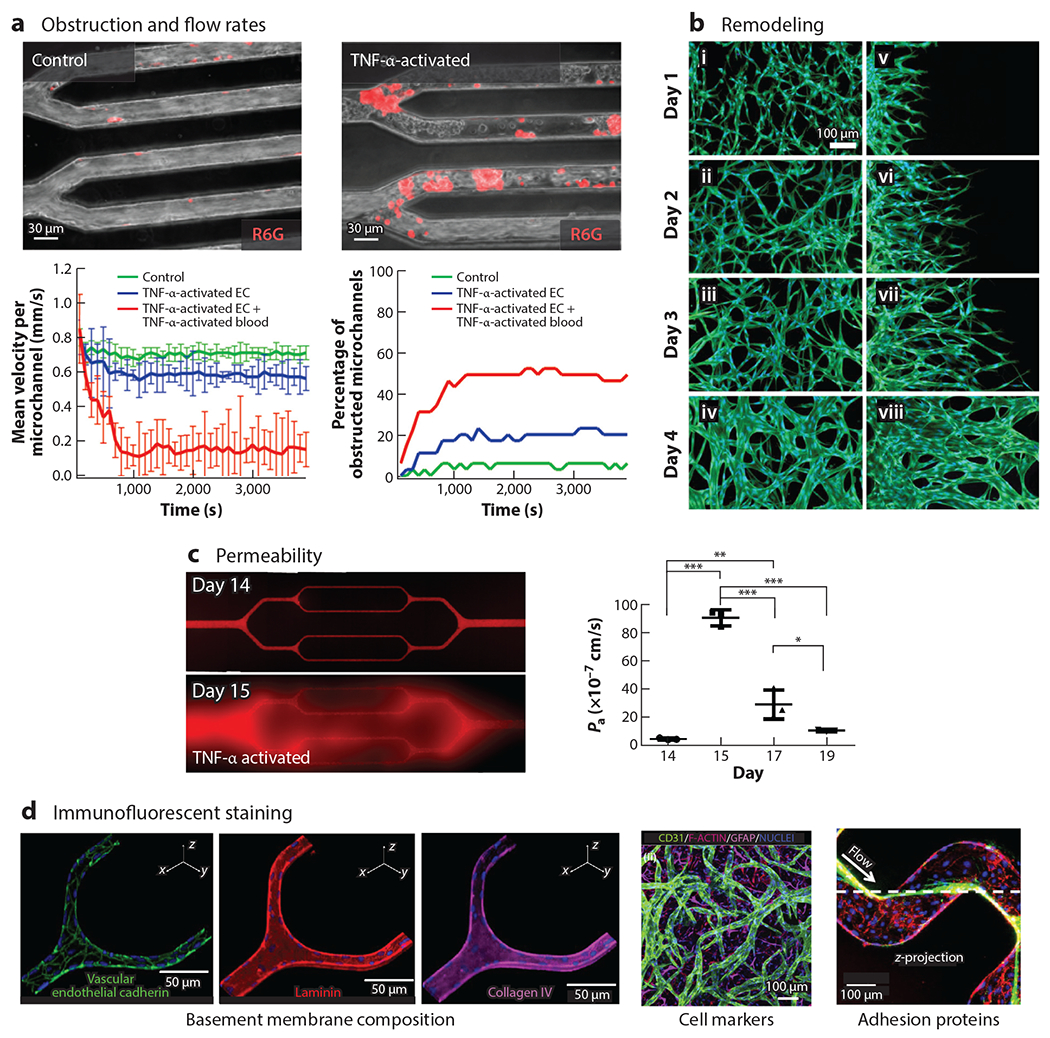
Measurements of in vitro microvasculature can measure all modes of dysfunction and help provide mechanistic data. As in vitro microvasculature is much easier to visualize than corresponding in vivo structures, it can provide a rich amount of quantitative information. (a) In vitro postcapillary venule obstruction and flow rates can be quantitated, here shown in response to TNF-α. Panel a adapted from Reference 54. (b) In vitro changes to microvasculature morphology and shape. Panel b adapted from Reference 71. (c) Exceptional permeability measurements can be performed and quantitated, especially ones lasting multiple days, to examine recovery of the microvasculature. Shown here is the permeability of the endothelium to BSA-AF549 tracer before and after TNF-α perfusion between days 14 and 15. P values were calculated using one-way analysis of variance with Bonferroni’s post hoc test (*P < 0.05, **P < 0.01, ***P < 0.001). Panel c adapted from Reference 35. (d) Immunofluorescent staining can be used to identify basement membrane composition, cell markers, and adhesion proteins, such as the von Willebrand factor, an adhesion that mediates platelet adhesion at high shear rates. Panel d adapted from References 35, 75, and 66, respectively. Abbreviations: EC, endothelial cell; GFAP, glial fibrillary acidic protein; TNF-α, tumor necrosis factor alpha.