Figure 3.
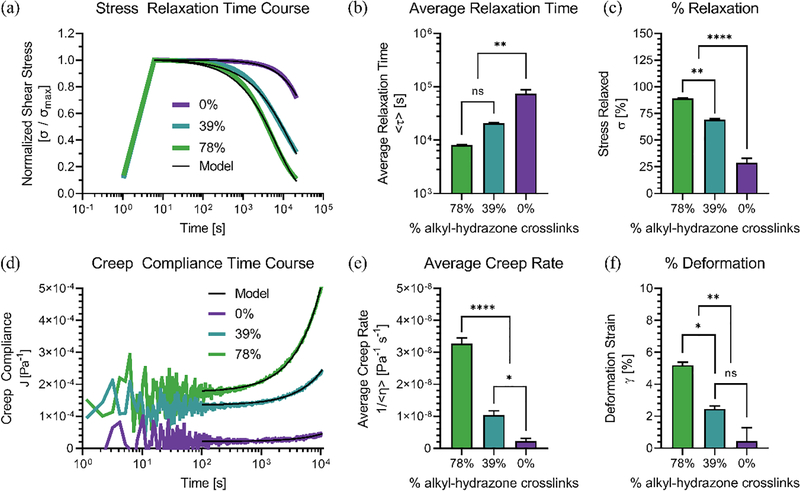
Shear rheometry was used to measure the viscoelastic responses of hydrazone CANs to step-changes. (a) Differences in viscoelastic stress relaxation between hydrazone CANs represented by variations in the normalized shear stress (σ/σmax) over time compared to model fits. (b) Average relaxation times (<τ>) represent the characteristic network reorganization timescales for each formulation. Stress relaxation data was fit with the Kohlrausch–Williams–Watts stretched exponential function (Equation 2) followed by integration to calculate the average relaxation times (Equation 3). (c) Hydrazone CANs relax different amounts of the initial stress over the course of 6 hours. (d) Differences in viscoelastic creep compliance (J) between hydrazone hydrogel formulations over time compared to model fits. (e) Linear average creep rates (<1/η>) as a function of hydrogel compositions. The creep compliance data were fit to (Equation 4), excluding initial creep ringing. (f) Hydrazone CANs were strained by different amounts over the course of 2 hour creep tests, and the final strain (γ) was plotted as a function of network composition. Traces represent average measurements made in triplicate (n=3) with standard error where appropriate. Statistics represent the results of one-way ANOVA with Tukey’s MCT showing P ≥ 0.05 = ns, P < 0.05 = *, P < 0.01 = **, P < 0.001 = ***, P < 0.0001 = ****.

