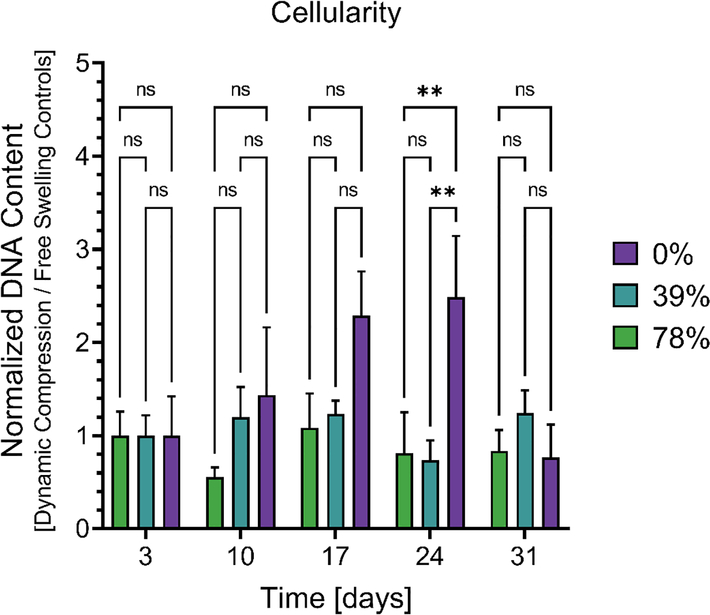
Figure 5.
Changes in double stranded DNA content due to dynamic compression. Data represents dynamically compressed samples normalized by free swelling controls to show relative changes caused by dynamic loading. Data from four CANs were averaged for each condition (n = 4) with standard error. Statistical significance represents the results of a two-way ANOVA with Tukey’s MCT where P ≥ 0.05 = ns, P < 0.05 = *, P < 0.01 = **, P < 0.001 = ***, P < 0.0001 = ****.

