
FIGURE 1.
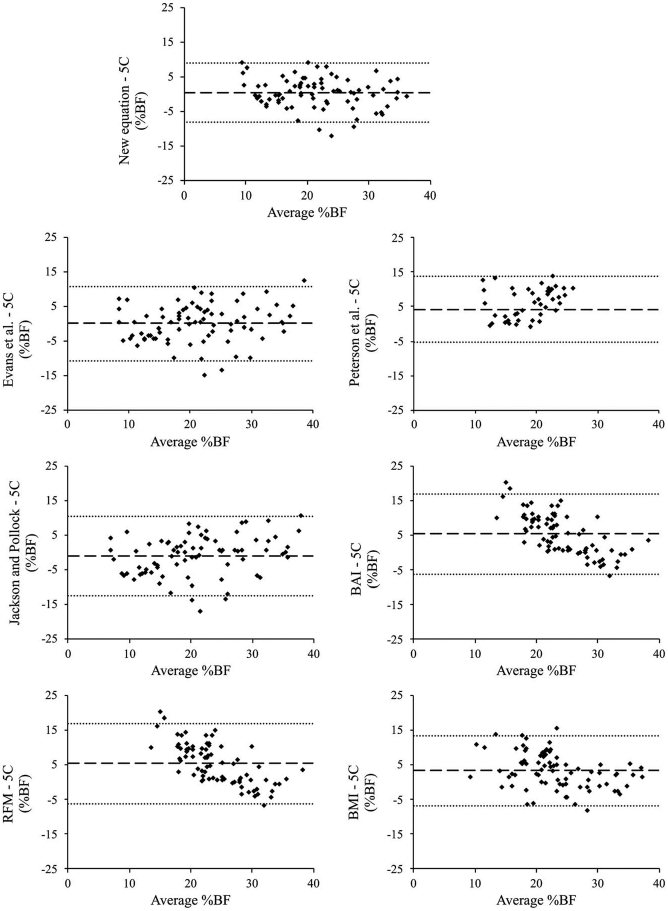
Bland–Altman plots showing predicted versus criterion 5C %BF in the cross-validation cohort (n = 78). Dark center line represents mean bias. Light dotted outer lines represent limits of agreement (bias ±1.96 SD of bias).
Official websites use .gov
A
.gov website belongs to an official
government organization in the United States.
Secure .gov websites use HTTPS
A lock (
) or https:// means you've safely
connected to the .gov website. Share sensitive
information only on official, secure websites.
Bland–Altman plots showing predicted versus criterion 5C %BF in the cross-validation cohort (n = 78). Dark center line represents mean bias. Light dotted outer lines represent limits of agreement (bias ±1.96 SD of bias).