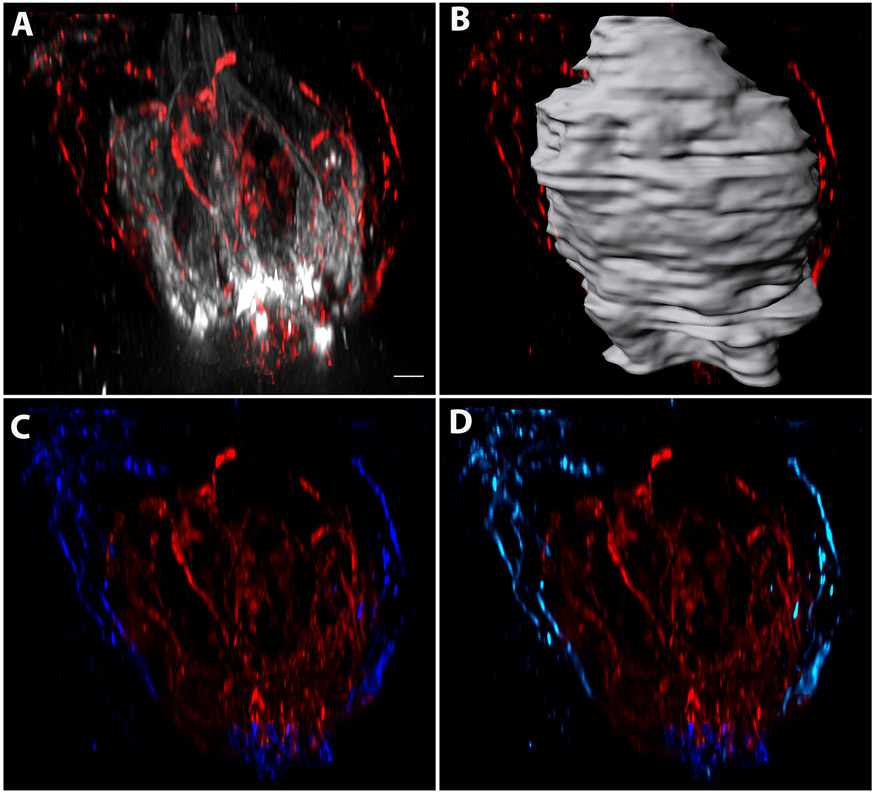
Figure 7: Quantifying innervation to the papilla.
(A) Some labels for taste neurons also label innervation to the papilla. (B)The innervation within the taste bud is separated from the innervation outside the taste bud by segmenting the taste bud (as described for Figure 3), (C) masking the innervation inside the taste bud (red), and then masking the innervation outside of the taste bud only (dark blue). The volume of innervation to the taste bud (red) was 1649.6 μm3. The innervation outside the taste bud will include taste fibers underneath the papilla that should not be included in the quantification of the innervation to the papilla. (D) The fluorescence of the innervation to the papilla was masked (light blue). The volume of innervation to the papilla was 121.8 μm3. Scale bars in A-D = 4 μm.

