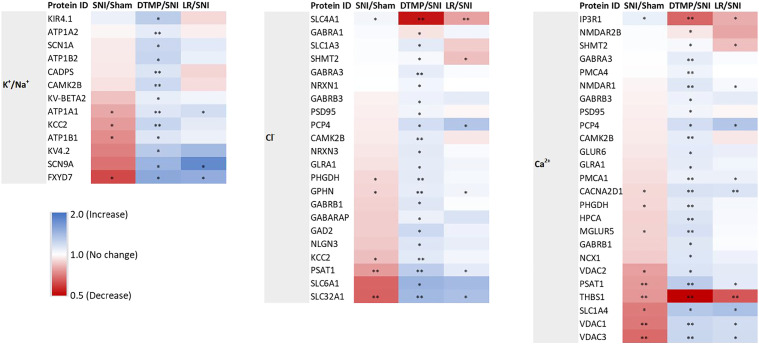
Figure 2.
Heat maps illustrating fold changes in expression levels of proteins involved in regulation of K+/Na+ (left), Cl− (center) and Ca2+ (right) by DTMP and LR SCS relative to the pain model (DTMP/SNI and LR/SNI, respectively). The effect of the pain model relative to no injury is also included (SNI/Sham) to compare the effect of SCS treatments. For instance, pain tend to decrease gene expression, while DTMP tends to increase it, thus reversing the effect of pain. * denotes p < 0.05, ** denotes p < 0.001.

