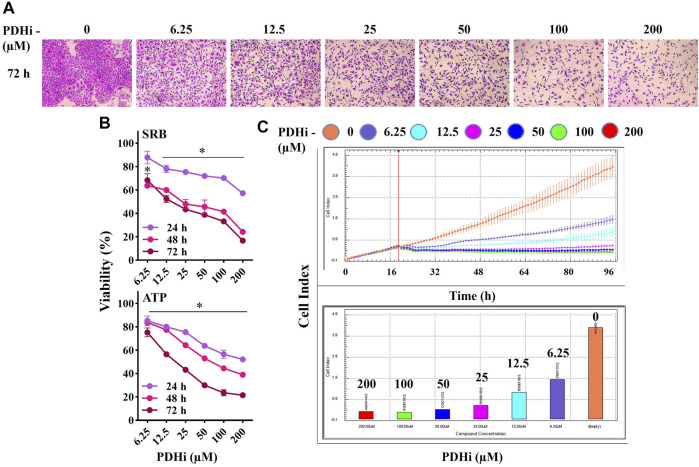
FIGURE 1.
PDHi treatment resulted in growth inhibition. (A) A549 cells were treated (72 h) with PDHi at indicated doses and after staining with SRB dye, cells were photographed under phase contrast microscope (magnification 100×). (B) The effect of PDHi on the growth of A549 cells was quantified by SRB and ATP viability assays. Data are presented as mean ± SEM. (C) The cell index (CI) values for 0–200 μM (represented by different colours) of PDHi on A549 cells was generated by real time cell analyzer (RTCA). * Significantly difference compared to untreated cells (p < 0.0001).

