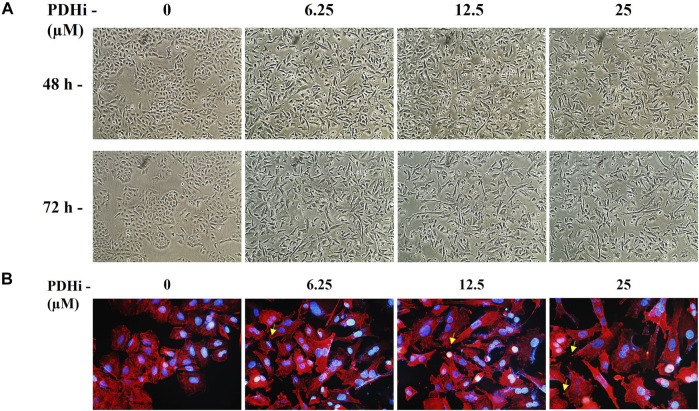
FIGURE 2.
PDHi-induced morphological changes in A549 cancer cells. (A) Cells treated with PDHi for 48–72 h (Supplementary Figure S6 for morphological changes in HT29 and MCF7 cancer cells) at indicated doses and were photographed under phase contrast microscope (magnification 100×). (B). Phalloidin staining indicated F-actin (red) reorganization in PDHi treated A549 cells. DAPI was used to stain DNA (blue, magnification 400×).

