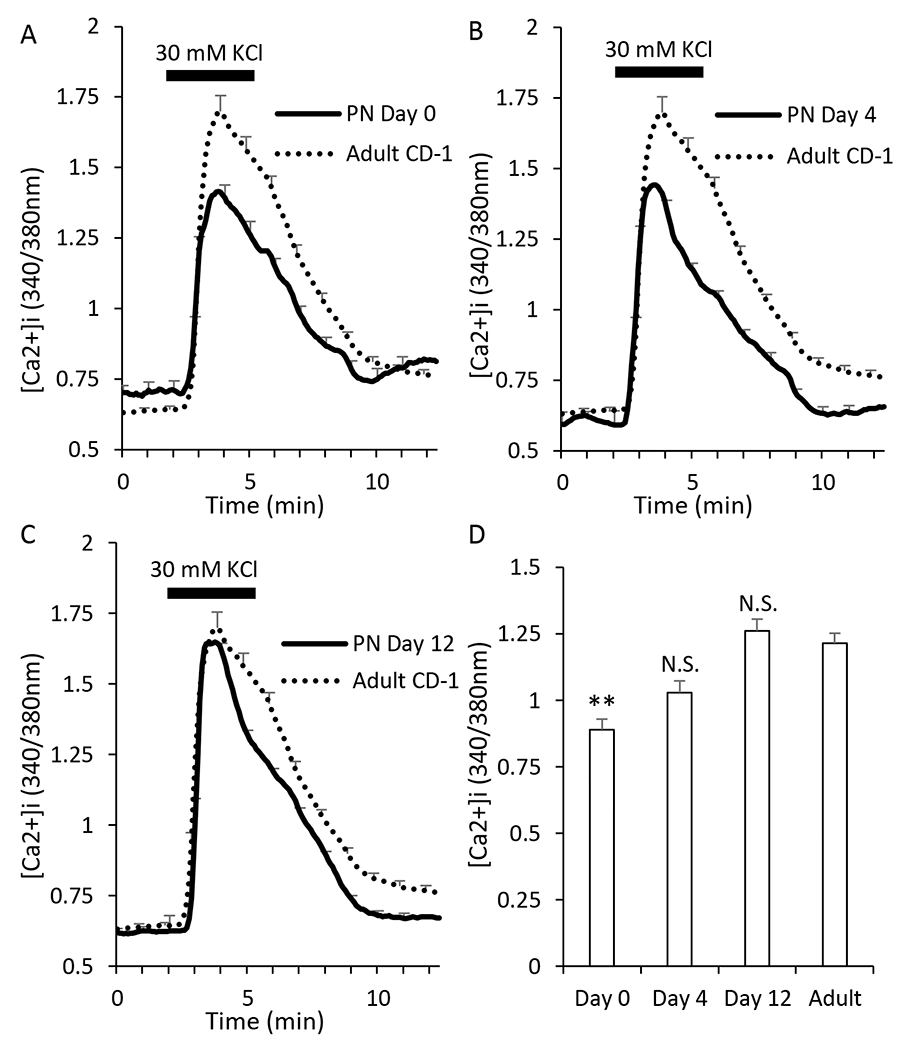
Figure 3. Response to KCl stimulation is decreased at early neonate stages.

A-C. Traces showing the response to electrical stimulation (KCl) after exposure to 3mM glucose for neonatal islets at postnatal day 0 (A, N=23), day 4 (B, N=24), and day 12 (C, N=24). Adult traces (dotted black lines, N=86) are used for comparison to the neonatal progression. D. Bar graph of the amplitude of response to stimulation. Asterisks (*) indicate differences between adult and neonatal [Ca2+]i traces based on N=3 sets of islets for each neonatal day and N=9 for adult. **P<0.01, N.S. not significant.
