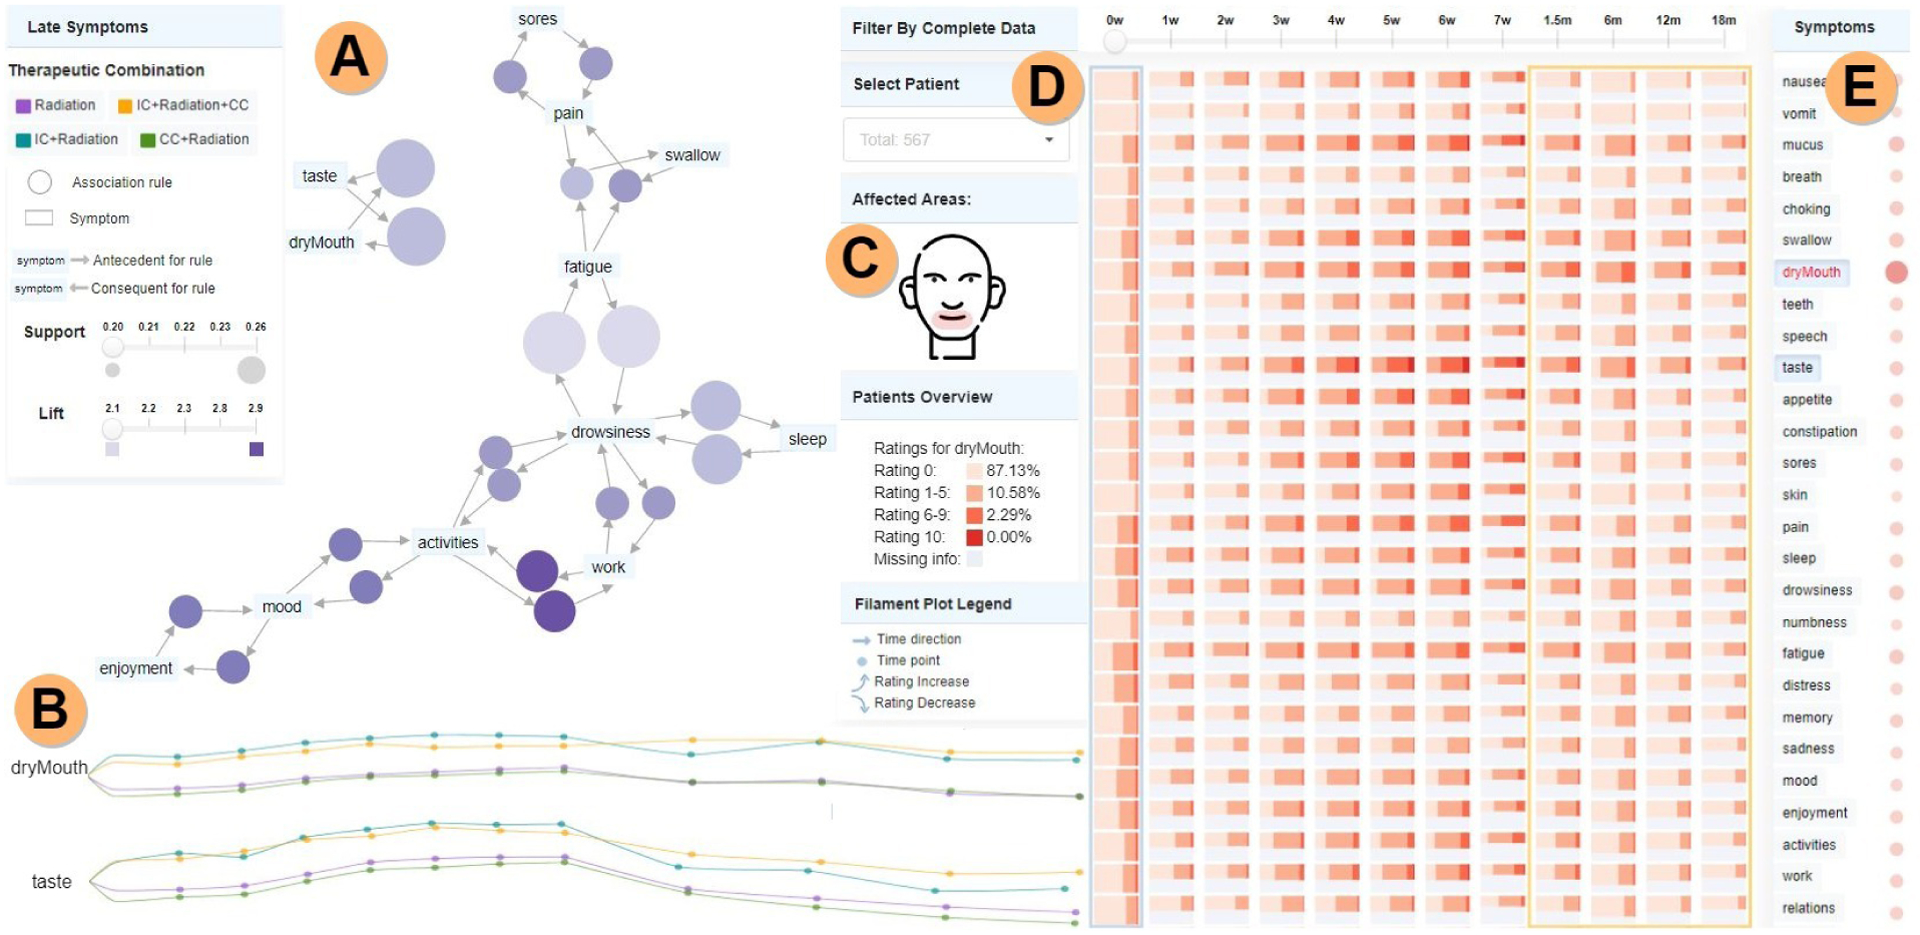
Fig. 1.

THALIS analysis of longitudinal symptom data. A) Association Rule Diagram panel, showing here association-rule-mining (ARM) relationships among the most frequent late-stage symptoms; rules are represented using bubbles, with size and color encoding the support and lift metrics. B) Symptom trajectory panel—filament plots encode here mean rating values per therapeutic combination, with more frequent observations in the acute stage (left-end) than in the late stage (right-end). C) Sketch of areas affected by the selected symptoms (dry mouth and taste). D) Cohort symptom panel showing via summarization with shade and height the percentile rating distribution. E) Correlation matrix showing associations with the selected symptom. Image cropped and edited for in-print legibility.
