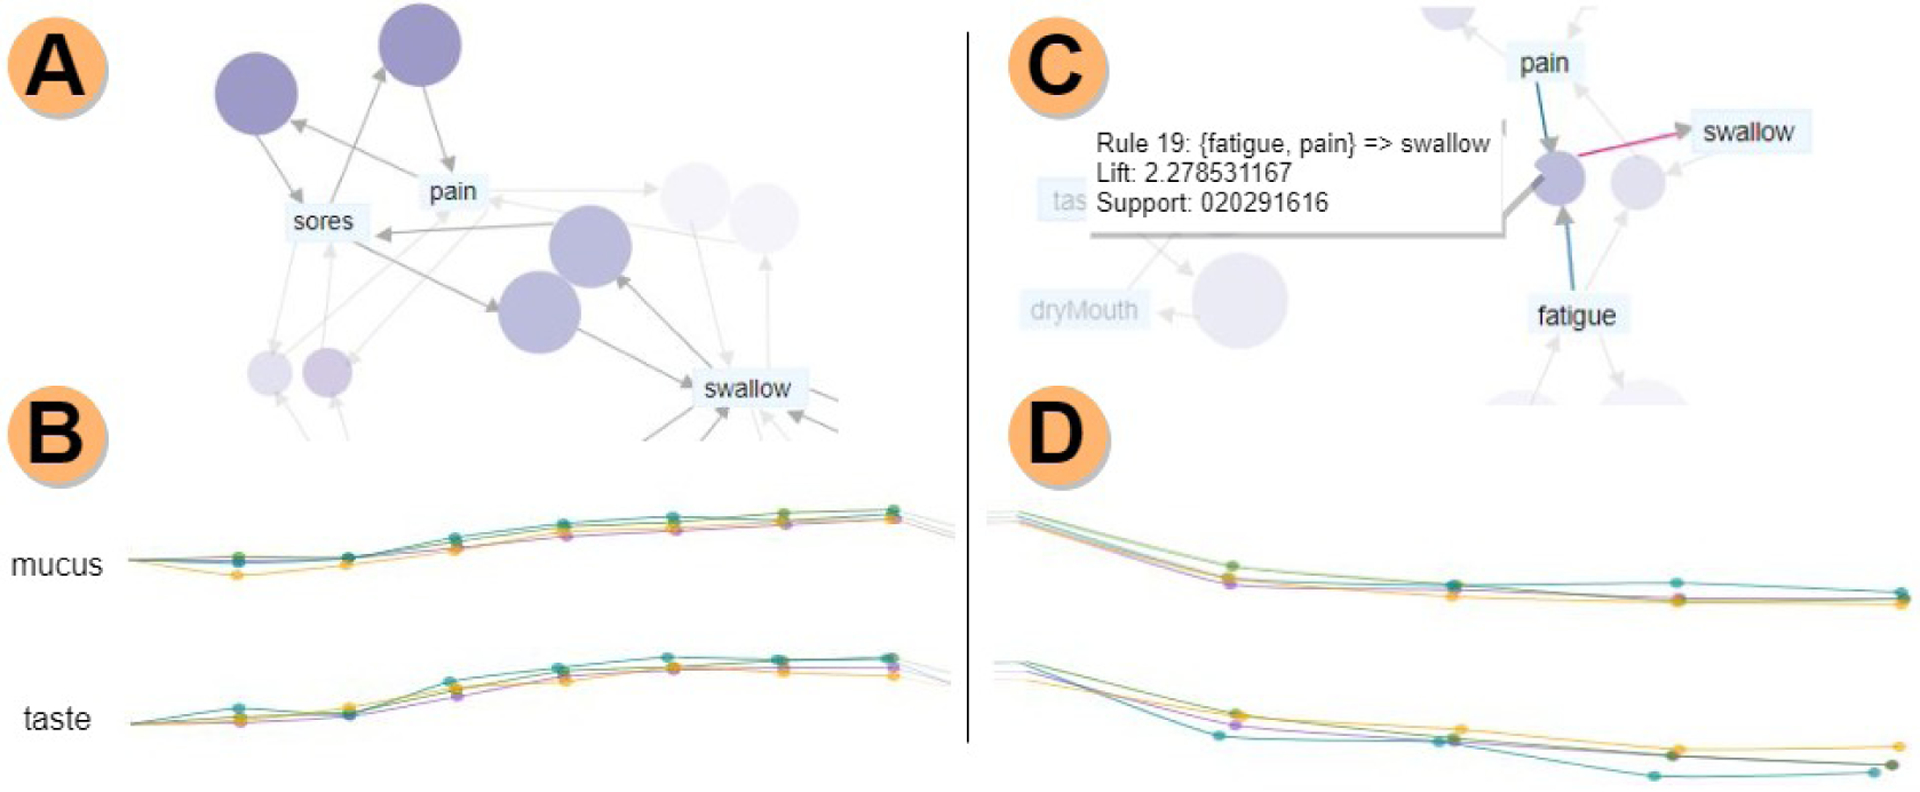
Fig. 3.

Acute vs. late phase analysis. A) Association rule diagram for the acute phase. Rules are filtered based on support (frequency) and lift (dependency between symptoms); other rules are faded in the background. B) Mean rating value filament plots for all therapies, with the acute phase highlighted. All therapies follow similar trajectories for both mucus and taste, and towards the end of the acute phase, taste has a considerable increase in ratings for all therapies. C) Association rule diagram for the late phase, showing the antecedents (fatigue, pain) and consequent (swallow) for rule 14. D) Mean rating value filament plots, showing a slightly different trajectory for IC+Radiation.
