
Figure 1: Temporal transitions in locomotor behavior and neuronal transcriptome.
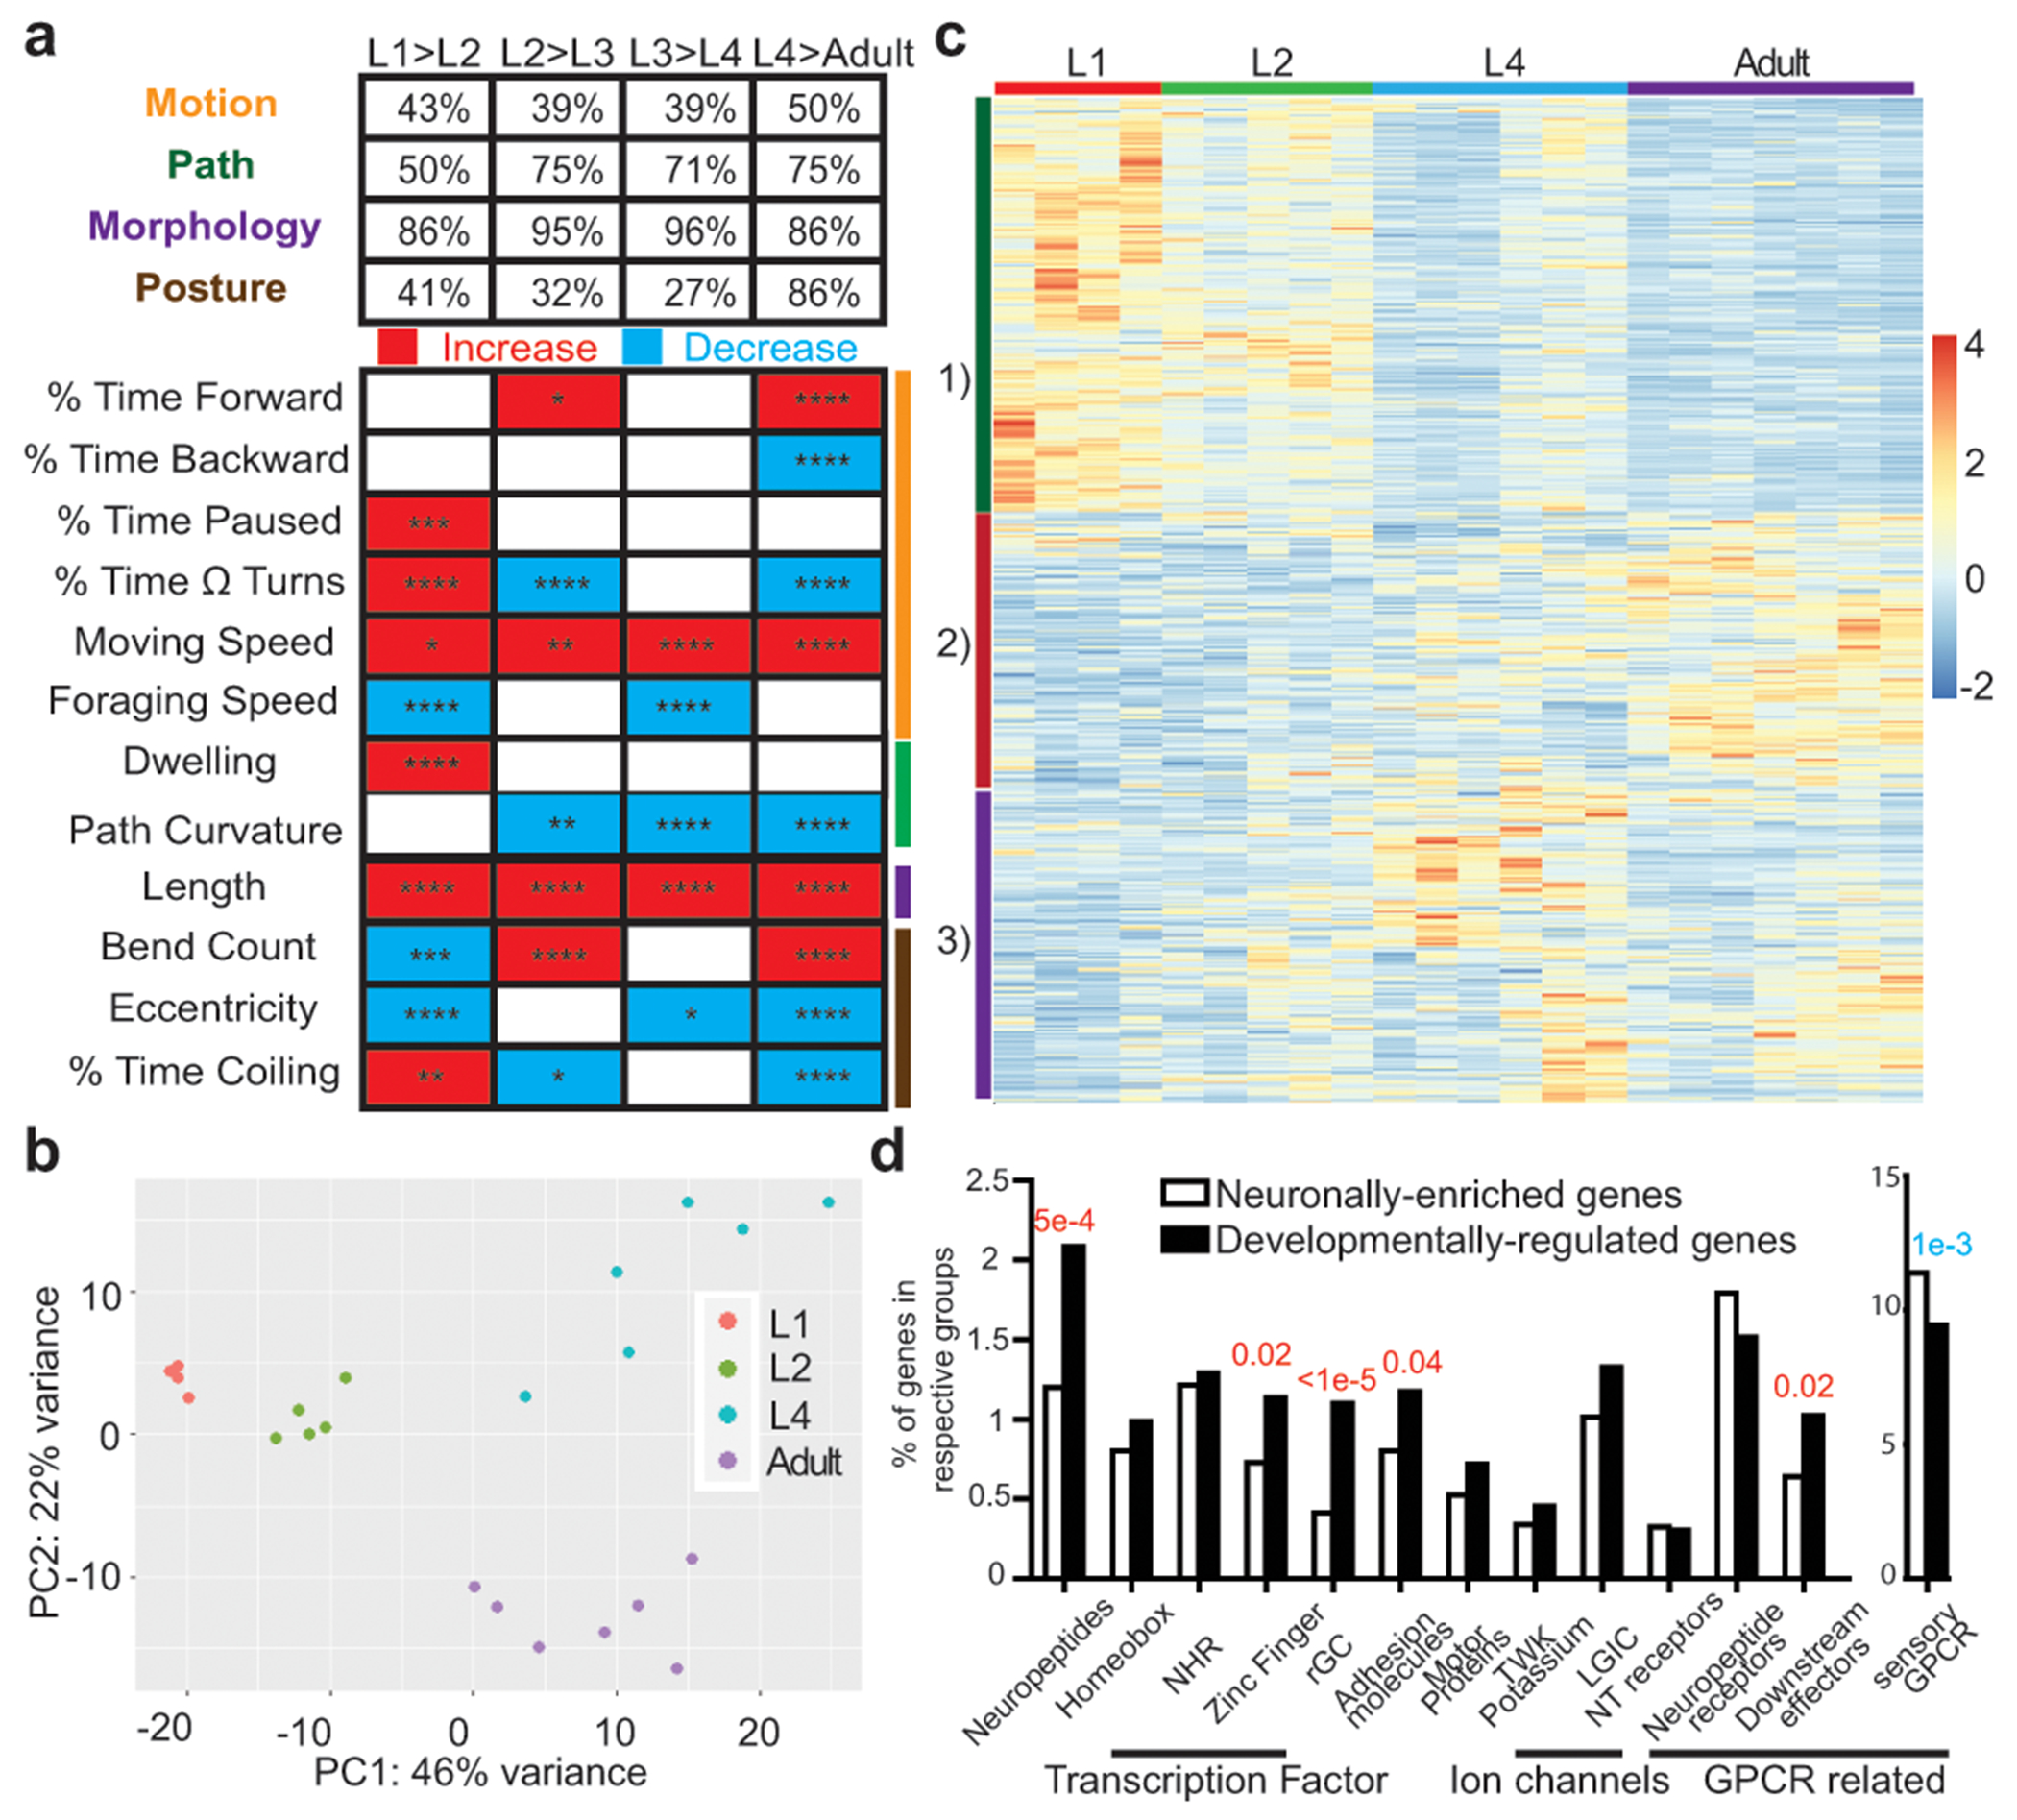
a, Developmental transition in locomotor behavior across post-embryonic life stages, as measured by automated single worm tracking 13. Upper panel: percentage of parameters in each of the 4 broad categories that are different across each transition (q<0.05). Bottom panel: representative parameters from each category, as indicated by color-coded lines on the right, across development. Red and blue rectangles: increases and decreases in each parameter, respectively. Sample size: L1,47; L2,48; L3,41; L4,129; Adult,107. Wilcoxon rank-sum tests and false-discovery rate q values for each comparison are presented in each rectangle: *q<0.05; **q<0.01, ***q<0.001, ****q<0.0001. Additional details available in Supplementary Table 1. b, Principal component analysis (DESeq2) of neuronal transcriptome across post-embryonic development. Each dot represents a RNA-seq analysis replicate. c, Heatmap of the 2639 developmentally regulated genes (padj<0.01) across post-embryonic life stages. Values were z-score normalized and plotted using pheatmap in R studio. Each row, clustered according to pattern, represents a single gene, and each column represents a single RNA-seq replicate. d, Enrichment/depletion of gene families in the 2639 developmentally regulated genes compared to all 7974 neuronal enriched genes (one-sided z-score test for two population proportions), with red and blue p-values indicating over-representation and under-representation, respectively.