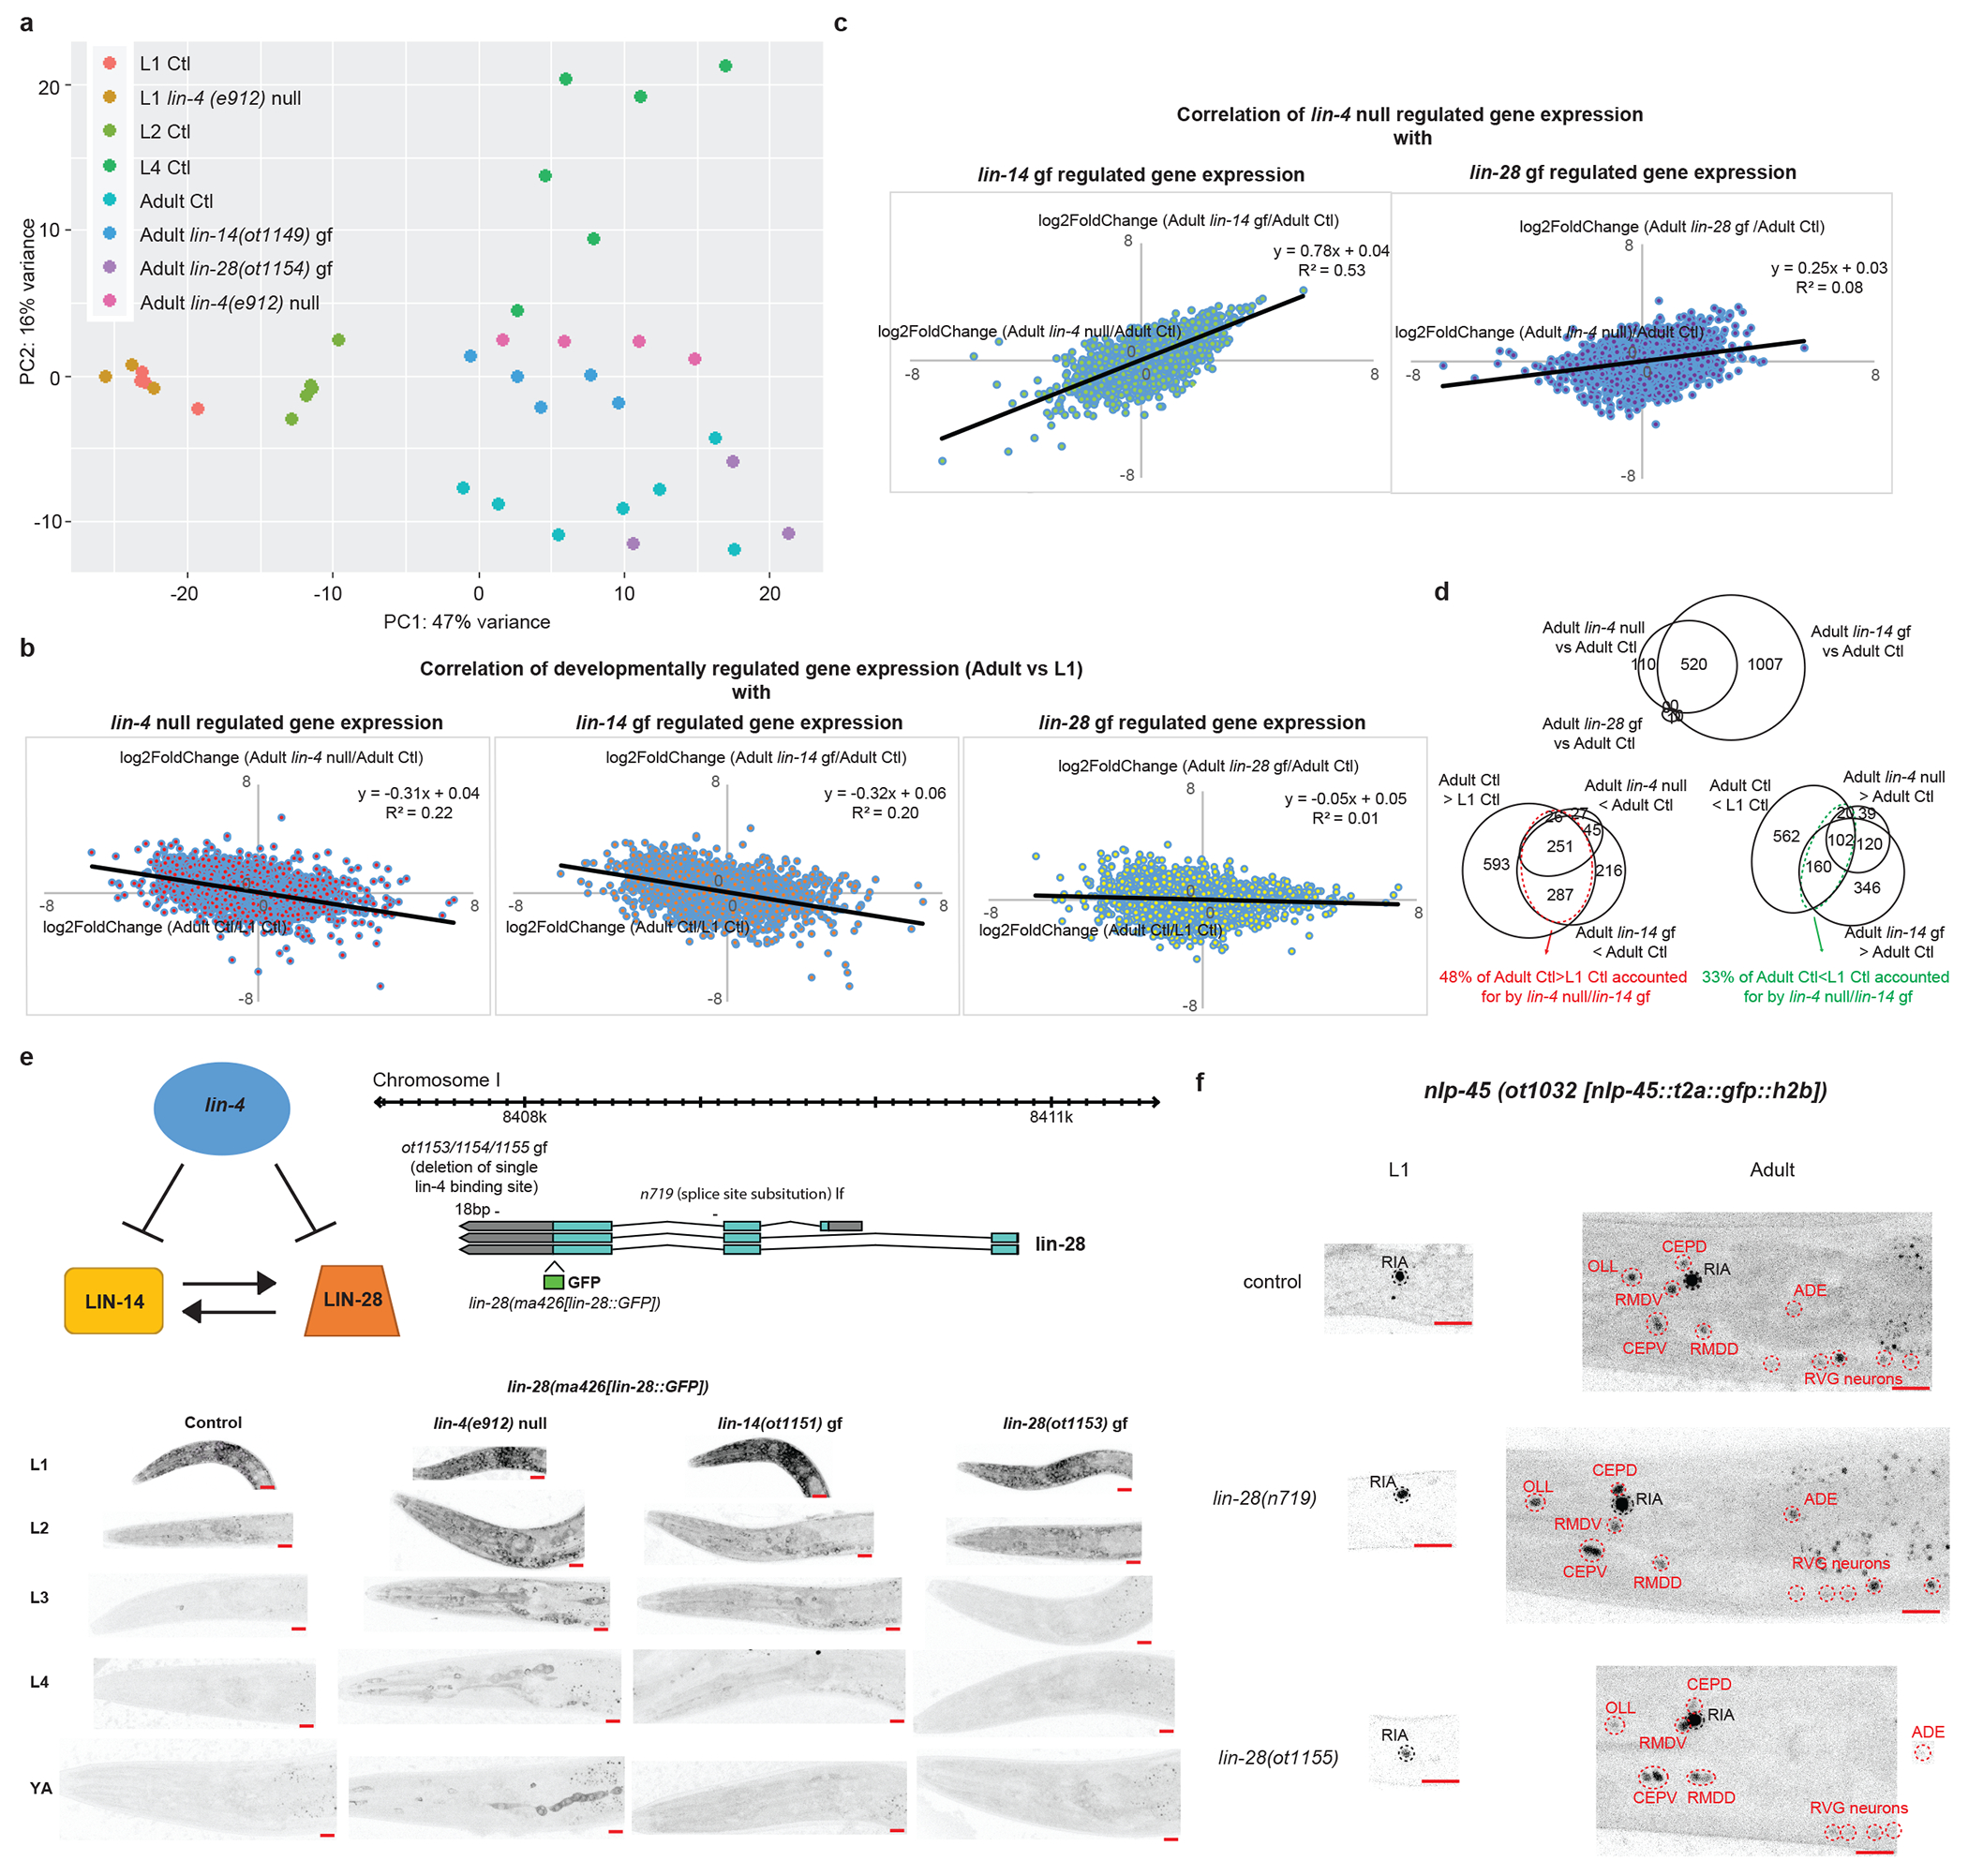
Extended Data Fig.6: lin-4 controls a subset of the developmentally-regulated gene battery through direct repression of lin-14, and not lin-28.

a, lin-4(e912) null mutation juvenizes a subset of the adult control(Ctl) neuronal transcriptome to resemble that of the L1 Ctl neuronal transcriptome through direct de-repression of lin-14 and not lin-28. Principal component analysis (PCA) of the neuronal transcriptomes across post-embryonic development and across genotypes was conducted using DESeq2 in R studio. Each dot represents a replicate in the RNA-seq analysis. b, Correlation between developmentally gene expression changes (log2FoldChange[Adult Expression/L1 Expression]) with gene expression changes in lin-4(e912) null mutation (log2FoldChange[Adult lin-4(e912) null expression/Adult control expression], left), in lin-14(ot1149) gain of function (gf) mutation (log2FoldChange[Adult lin-14(ot1149) gf expression/Adult control expression], middle), and in lin-28(ot1154) gf mutation (log2FoldChange[Adult lin-28(ot1154) gf expression/Adult control expression], right). Linear regression was fitted through each set of data points, and the equation and R2 values are shown for each. lin-4 null and lin-14 gf mutations accounted for some of the developmentally gene expression changes between L1 and adult, while lin-28 gf mutation did not. c, Correlation between gene expression changes in lin-4(e912) null mutation (log2FoldChange[Adult lin-4(e912) null expression/Adult control expression]) with gene expression changes in lin-14(ot1149) gf mutation (log2FoldChange[Adult lin-14(ot1149) gf expression/Adult control expression], left), and in lin-28(ot1154) gf mutation (log2FoldChange[Adult lin-28(ot1154) gf expression/Adult control expression], right). Linear regression was fitted through each set of data points, and the equation and R2 values are shown for each. lin-14 gain of function mutation accounted for most of the changes observed in the lin-4 null mutation, but lin-28 gain of function mutation did not. d, Top Venn diagram showing that the difference between the adult lin-4 null neuronal transcriptome compared to the adult control(Ctl) neuronal transcriptome is largely recapitulated in the transcriptome of adult lin-14(ot1149) gf mutants. Only one gene is significantly different in the adult lin-28(ot1154) gf vs adult control comparison and does not overlap with the genes regulated by lin-4/lin-14. Bottom left Venn diagram showing that 48% of genes that demonstrate developmental upregulation (adult control(Ctl)>L1 Ctl) are juvenized in the adult lin-4 null and/or lin-14(ot1149) gf animals. Bottom right Venn diagram showing that 33% of genes that demonstrate developmental downregulation (adult control(Ctl)<L1 Ctl) are juvenized in the adult lin-4 null and/or lin-14(ot1149) gf animals. e, lin-4 regulates lin-28 mainly through lin-14 and not through direct repression of lin-28. On the top left is the schematic of the regulation between lin-4, lin-14 and lin-28 based upon previous studies. On the top right is the schematic of the lin-28 translational GFP allele, as engineered by CRISPR-Cas9, as well as lin-28(ot1153/54/55) gf and lin-28(n719) lf alleles. These three gf alleles represent the same molecular lesion (deletion of single lin-4 binding site in the lin-28 3’UTR) but independent CRISPR-Cas9 mediated deletion events. On the bottom are the representative images of the lin-28 translational GFP allele across post-embryonic development in control, lin-4(e912) null, lin-14(ot1151) gf, and lin-28(ot1153) gf animals. The signal is diffuse and cytoplasmic but can be observed in all tissues including the nervous system in early larval animals. Red scale bars (10μm) are on the bottom right of all representative images. LIN-28 is downregulated across post-embryonic development. lin-4(e912) null and lin-14 (ot1151) gf mutations delay the downregulation of LIN-28, particularly during the L2->L3 transition, while the lin-28(ot1153) gf mutation does not. f, lin-28 does not regulate developmental expression pattern of nlp-45. Representative images of the nlp-45 expression reporter in control, lin-28(n719) lf and lin-28(1155) gf animals. Neurons that are labelled in black are not developmentally regulated while those that are labelled in red are developmentally upregulated. Red scale bars (10μm) are on the bottom right of all representative images.
