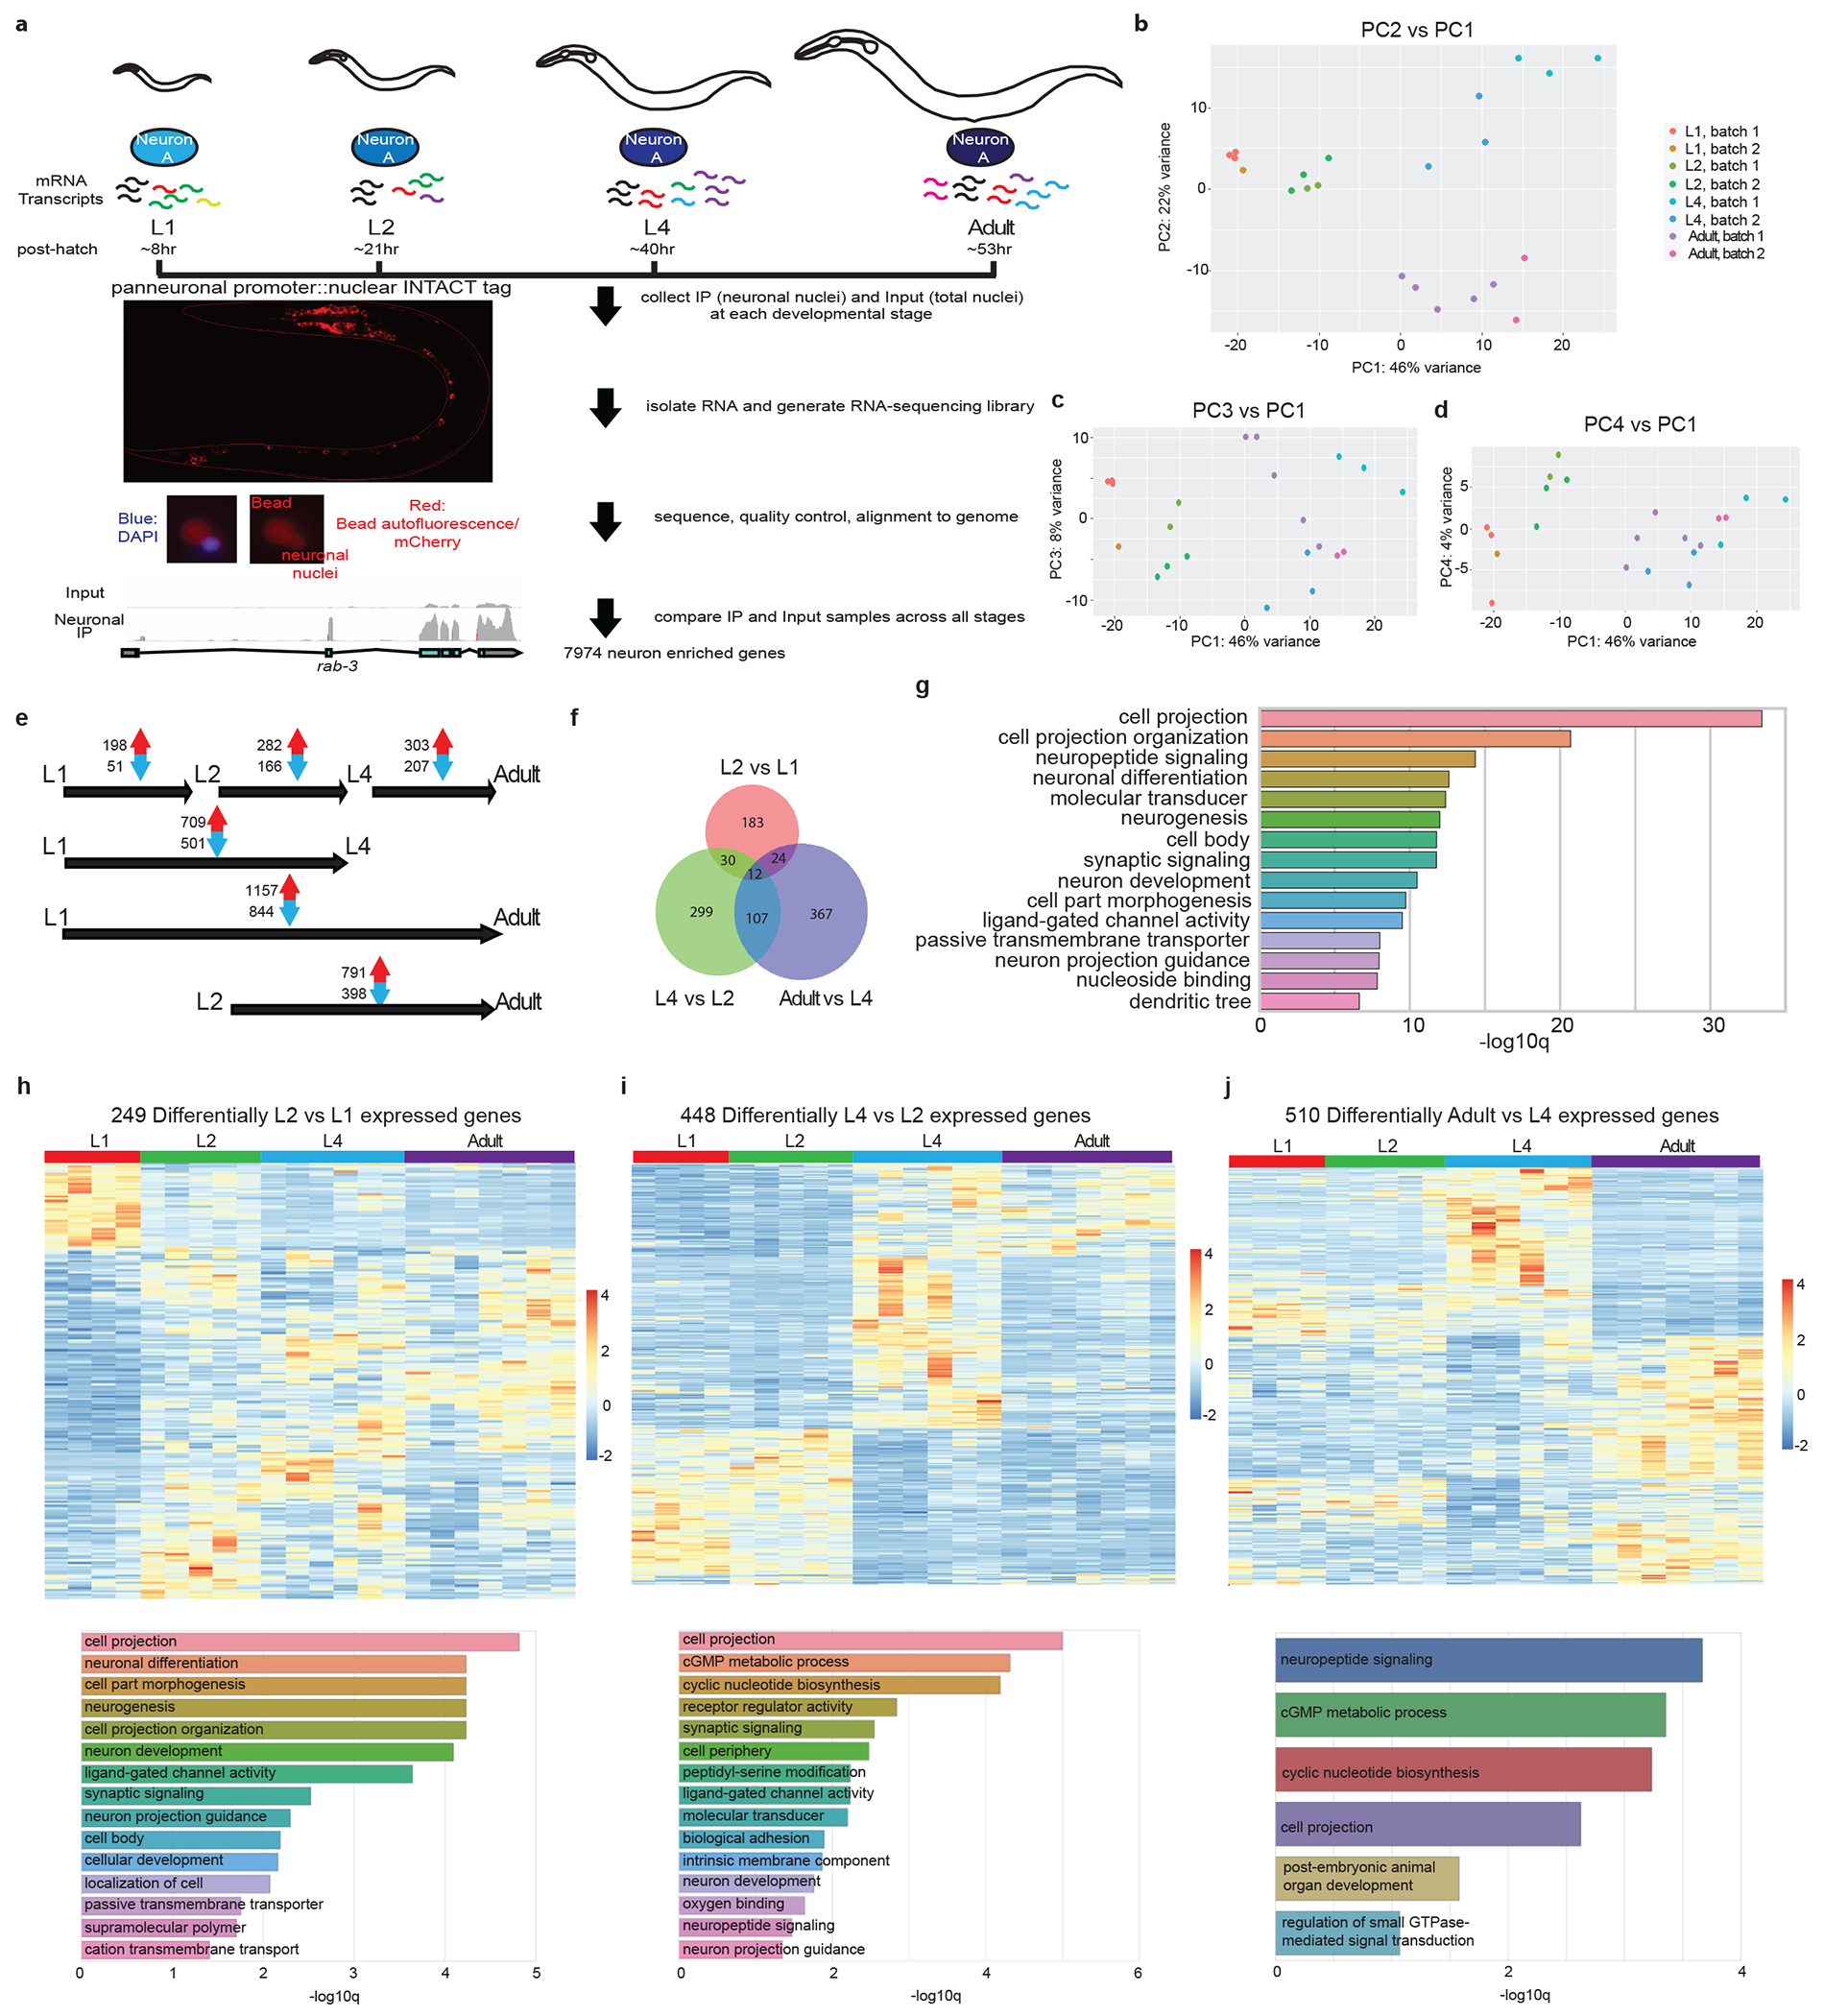
Extended Data Fig.1. Developmental transitions in neuronal transcriptome across post-embryonic life stages.

a, Schematic and experimental design for INTACT sample collection, protocol, and data analysis for neuronal transcriptome profiling across development. Representative images of the panneuronal INTACT strain as well as neuronal nuclei after immunoprecipitation (IP) are shown in bottom left panels. Representative tracks from IGV are shown for input and neuronal IP samples to demonstrate IP enrichment for panneuronally expressed gene, rab-3.
b-d, Principal component analysis (PCA) of neuronal transcriptome across post-embryonic development was conducted using DESeq2 in R studio 42. Both batch as well as developmental stage were taken as factors for analysis. Each dot represents a replicate in the RNA-seq analysis. b, PC2 vs PC1. PC1 and 2 delineated the transitions between early larval (L1 and L2) stages and late larval (L4)/adult stages, and between all larval (L1 through L4) stages and the adult stage, respectively. c, PC3 vs PC1. PC3 largely accounted for variation as a result of batch. d, PC4 vs PC1. PC4 largely accounted for L2 specific changes.
e, The numbers of significant (padj<0.01) increases/decreases in gene expression are shown for each stage transition. f, Venn diagram of developmental changes in neuronal gene expression across different stage transitions, showing some overlaps but also distinct developmental changes across each stage transition. g, Gene ontology analysis of the 2639 developmentally-regulated genes using the Enrichment Tool from Wormbase. h, Top: heatmap of the 249 developmentally-regulated genes between L1 and L2 stages across post-embryonic development. In addition to developmentally upregulated and downregulated genes, there was a small subset of genes that showed specific upregulation at the L2 stage. Bottom: gene ontology analysis of these genes using the Enrichment Tool from Wormbase.
i, Top: heatmap of the 448 developmentally-regulated genes between L2 and L4 stages across post-embryonic development. Bottom: gene ontology analysis of these genes using the Enrichment Tool from Wormbase. j, Top: heatmap of the 510 developmentally-regulated genes between L4 and adult stages across post-embryonic development. Bottom: gene ontology analysis of these genes using the Enrichment Tool from Wormbase.
