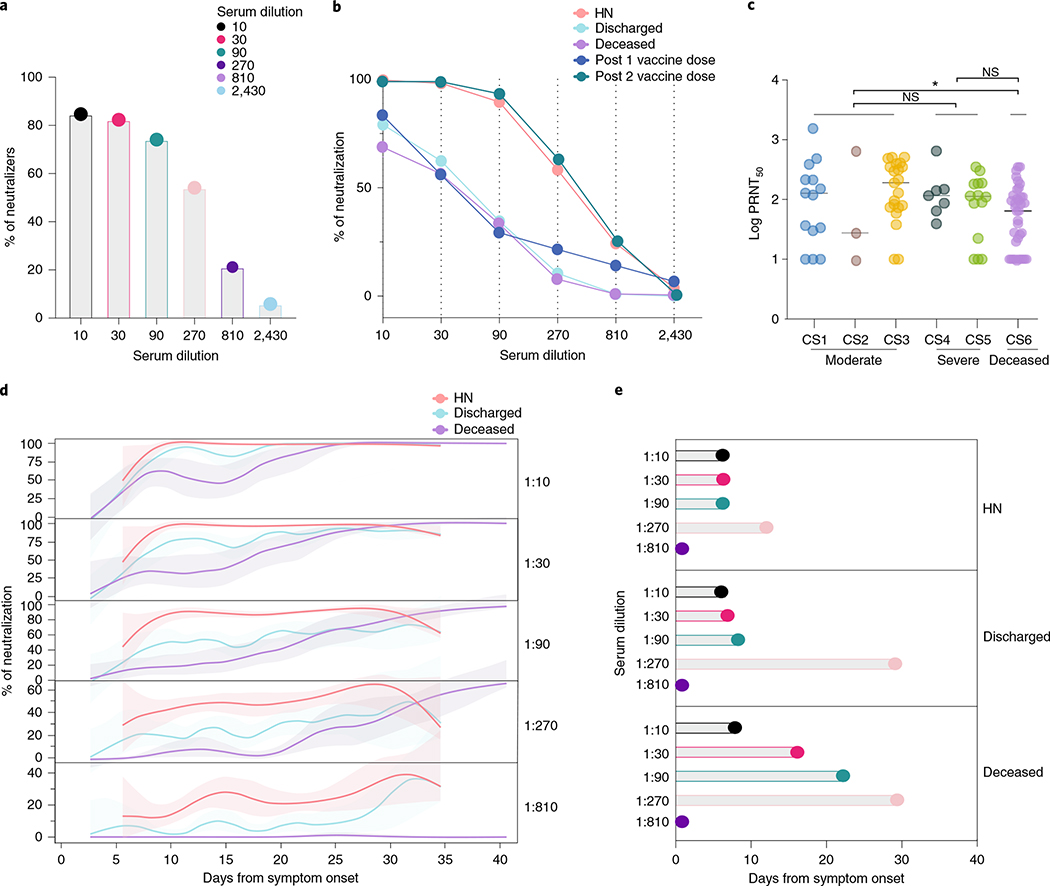
Fig. 3 |. Neutralizing antibody temporal dynamics distinguish discharged and deceased patients with COVID-19.
a–e, Longitudinal neutralization assay using wild-type SARS-CoV-2. a, Frequency of neutralizers, n = 83. b, Neutralization capacity among discharged (light blue), deceased (purple) and high neutralizer (HN) (red) patients at the experimental six-fold serially dilutions (from 1:3 to 1:2,430). HCWs, below the threshold for anti-S/RBD ELISA, were used as negative controls. Post 1 vaccine dose, 28 d after 1 vaccine dose. Post 2 vaccine dose, 7 d after 2 vaccine dose. (HCWs, n = 22; discharged, n = 41; deceased, n = 37; HN, n = 13; post 1 vaccine dose, n = 9; post 2 vaccine dose, n = 7). Pearson’s correlation analysis were used to accessed significance. HN: r2 0.785, P (two-tailed) 0.0185; discharged: r2 0.438, P (two-tailed) 0.1516; deceased: r2 0.437, P (two-tailed) 0.1524; Post 1 vaccine dose: r2 0.424, P (two-tailed) 0.1609; post 2 vaccine dose: r2 0.822, P (two-tailed) 0.0126. c, Maximum neutralization titer (PRNT50) per patient according to clinical severity scale as described in Methods. CS, clinical score. One-way ANOVA corrected for multiple comparisons using Tukey’s method was used to determine significance. *P = 0.0213. d, Longitudinal data plotted over time of neutralization capacity among discharged (light blue), deceased (purple) and HN (red) patients at the experimental six-fold serially dilutions (from 1:3 to 1:2,430). Lines indicates cross-sectional averages from each group, with shading representing 95% CI and colored accordingly. e, Average of days from symptom onset to reach 50% of neutralization at each experimental serum dilution among groups. CI, confidence interval; NS, not significant.

