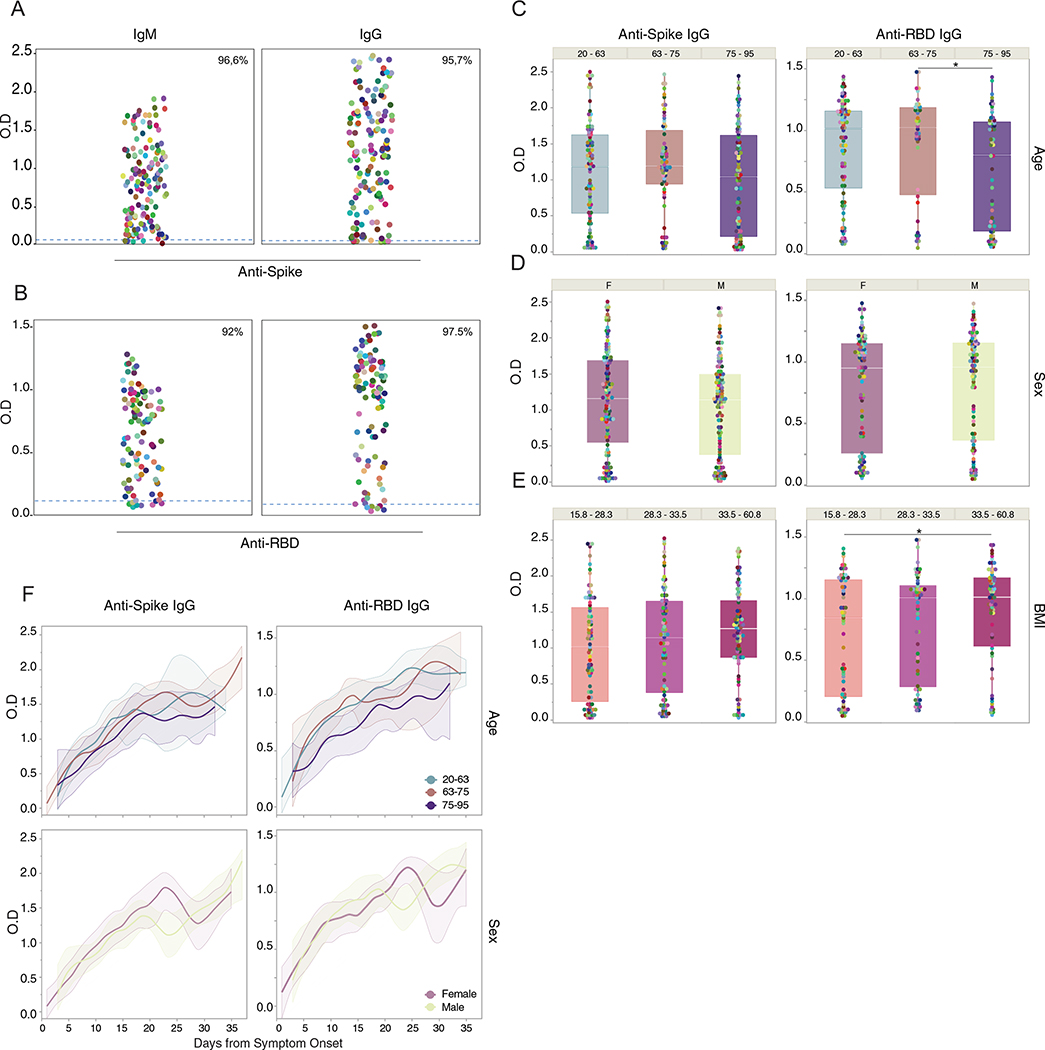
Extended Data Fig. 1 |. Correlation analysis of virus-specific antibodies and age, sex and BMI.
a-e, Plasma reactivity to S protein and RBD by ELISA. a, Anti-S IgM and IgG of total COVID-19 patients regardless of disease severity. Patients, IgM (n = 139); IgG (n = 159). b, Anti-RBD IgM and IgG of total COVID-19 patients regardless of disease severity. Patients, IgM (n = 99); IgG (n = 120). Each color dot represents a single individual at its maximum antibody titer over the disease course. Dashed line indicates HCW average values (limit threshold). HCW, Anti-S IgM (n = 21); IgG (n = 87); HCW, Anti-RBD IgM (n = 21); IgG (n = 21). IgG levels of Anti-S (left) or Anti-RBD (right) by (c) age, (d) sex and (e) BMI. Each dot represents a single individual at its maximum antibody titer over the disease course. Boxes represent variables’ distribution with quartiles and outliers. Horizontal bars indicate mean values. OD, optical density at 450 nm (OD450 nm). F, females; M, males. One-way ANOVA corrected for multiple comparisons using Tukey’s and unpaired t-test (two-tailed) were used to determine significance. Anti-RBD IgG *p = 0.0130 (age); *p = 0.0301 (BMI). f, IgG levels of Anti-S (left) or Anti-RBD by age and sex. Longitudinal analysis over time. Lines indicate cross-sectional averages from each group, with shading representing 95% CI and colored accordingly.

