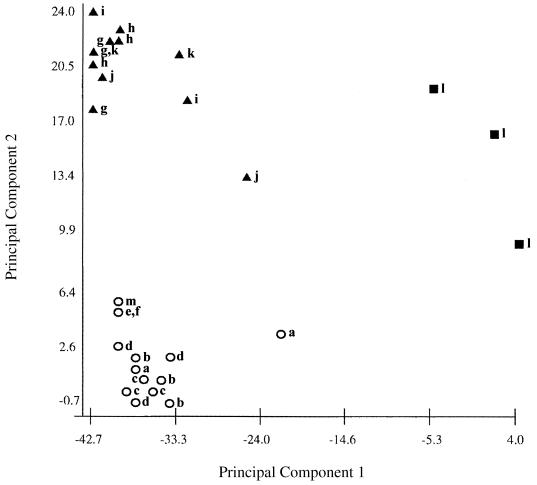
FIG. 1.
Two-dimensional plot generated by principal component analysis of fatty acid profiles showing the distribution of strains that are listed in Table 1. Circles, group A C. matruchotii; triangles, group B C. durum; squares, group C strain ATCC 43833. Data from repeat analyses are included. Strains: a, ATCC 14266; b, ATCC 14265; c, ATCC 33806; d, ATCC 43832; e, L2; f, Richardson's 13; g, ATCC 33449; h, ATCC 33822; i, LCDC 81-379; j, LCDC 86-376; k, LCDC 91-086; l, ATCC 43833; m, a dental isolate of C. matruchotii. Numbers on the axes indicate the Euclidean distance.

