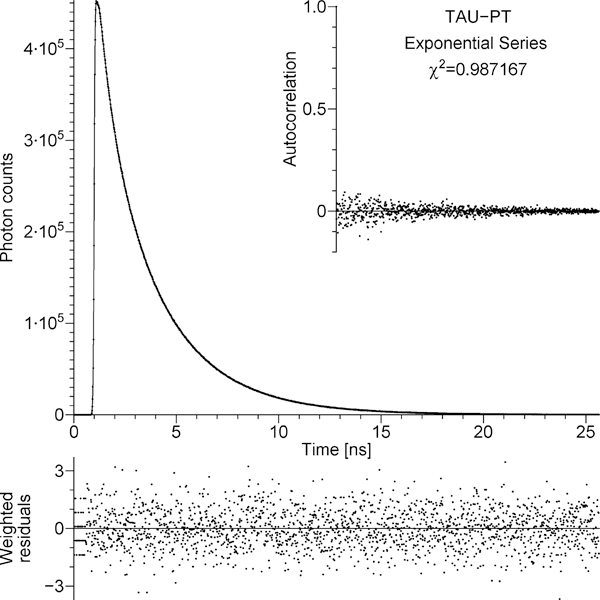
Figure 3.
Main panel: dots, the TCSPC data that represent the decay of the donor in the absence of the acceptor (unlabeled tetradecapeptide TAU-PT); solid line, the best fit obtained using exponential series model. Bottom strip: weighted residuals. Inset: autocorrelation of unweighted residuals. The figure is automatically generated by the program that fits TCSPC data; the χ2 shown in the figure has been divided by the number of degrees of freedom (the reduced χ2).

