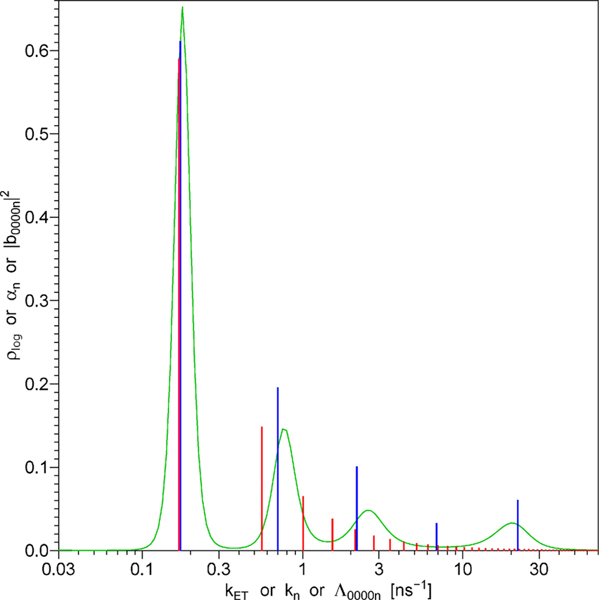
Figure 5.
Green line: the continuous distribution of energy transfer rates that represents the function F(t) in the case of no diffusion. Blue vertical bars represent the model of free discrete exponentials. Red vertical bars represent the model of dependent discrete exponentials; the rates and amplitudes of these exponentials are determined by just three model parameters, L, Lp, and DT, in accordance with the theory of the energy transfer in the presence of rotational and translational diffusion, section 5.

