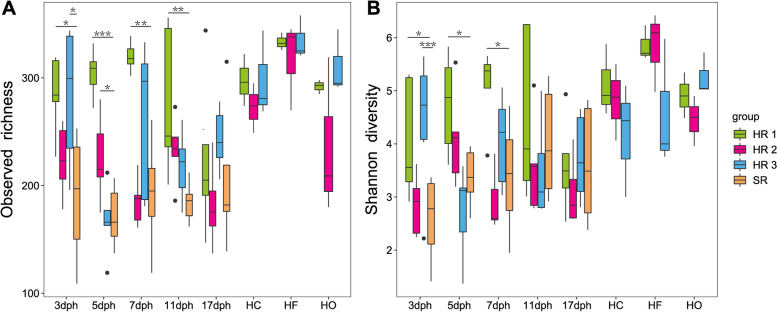
Fig. 1.
Boxplots showing the alpha diversity indices of gut microbiota from hen-reared (HR) chicks, separately reared (SR) chicks, and hens. A Observed richness and B Shannon diversity index. The horizontal bar in the boxes represents the median. The top and bottom of the boxes represent the 75th and 25th percentiles, respectively. The upper and lower whiskers extend to data not exceeding 1.5× the interquartile range from the upper edge and lower edge of the box, respectively. The asterisk represents significant difference in comparison to the separately reared group by the Dunnett test, *P < 0.05; **P <0.01;***P < 0.001. dph: days post-hatching; HC: hen cloacal swab; HF: hen feathers; HO: hen oropharyngeal swab

